SPATIAL AND TEMPORAL CHARACTERISTICS OF FISH RESOURCES IN ZHENJIANG YANGTZE RIVER DOLPHIN PROVINCIAL NATURE RESERVE WERE EVALUATED BASED ON HYDROACOUSTIC FREQUENCY DIFFERENCE TECHNIQUE
-
摘要: 为掌握镇江长江豚类省级自然保护区鱼类资源现状, 于2020年春季(4月)和秋季(9月)利用水声学频差技术和网具调查方法同步开展鱼类资源调查, 评估调查江段鱼类资源时空特征。水声学调查结果表明, 调查江段鱼类资源密度均值为(0.094±0.183) 尾/m2, 鱼类单体目标强度(Target strength, TS)均值为–(57.33±5.69) dB, 主要分布在–62.5— –50.5 dB, 随着水深的增加, TS逐渐增大; 网具调查结果表明, 调查江段共采集鱼类758尾、53.53 kg, 鉴定鱼类种类达48种, 其中以鲤形目(Cypriniformes)鱼类占优, 中上层鱼类群体数量和质量占比分别为36.15%和66.12%, 长江江豚饵料鱼类(体长小于20 cm、体高小于6 cm、体重小于100 g的中上层鱼类)数量和质量占比分别为23.22%和8.72%。在时间特征上, 4月和9月鱼类资源密度差异不显著(P>0.05), 4月鱼类TS均值小于9月, 且4月鱼类平均规格小于9月。在空间特征上, 鱼类资源主要分布于和畅洲北汊和焦北滩附近水域, 中上层鱼类资源相对较多, 且4月鱼类资源分布相对更集中。水声学频差技术能够有效地剔除水域环境中的浮游生物信号和背景噪声信号, 对于长江流域鱼类资源声学评估具有借鉴意义。研究结果可为准确评估该保护区长江江豚饵料鱼类资源, 支撑长江江豚就地保护, 并为长江下游鱼类资源养护工作提供科学依据。
-
关键词:
- 长江豚类省级自然保护区 /
- 水声学 /
- 频差技术 /
- 资源评估 /
- 目标强度
Abstract: In order to assess the current situation of fish resources in the Provincial Nature Reserve for Yangtze Cetacean of Zhenjiang, a simultaneous survey of fish resources was carried out in spring (April) and autumn (September) in 2020 by using hydroacoustic frequency difference technology and net survey method, and the temporal and spatial characteristics of fish resources in the surveyed river section were evaluated. Based on the analysis of fish echo image data of 200 and 333 kHz, the acoustic assessment of fish resources was carried out by frequency difference technique. The results of hydroacoustic survey showed that the average density of fish resources was (0.094±0.183) ind./m2, and the average target strength (TS) of fish was (–57.33±5.69) dB, mainly distributed in the range of –62.5 to –50.5 dB. In addition, TS increases with increasing water depth. The results of net survey showed that 758 fishes (53.53 kg) were collected in the river section and a total of 48 species were identified, of which Cypriniformes dominated. The proportion of pelagic fish population quantity and mass was 36.15% and 66.12%, respectively. The proportion of the quantity and mass of fish (pelagic fish with body length less than 20 cm, body height less than 6 cm and body weight less than 100 g) fed on the Yangtze finless porpoise was 23.22% and 8.72%, respectively. In terms of time characteristics, there was no significant difference in fish resource density between April and September (P>0.05), and the average TS in April was smaller than that in September, and the average size of fish in April was smaller than that in September. In terms of spatial characteristics, the fish resources were mainly distributed in the waters near the north branch of He Changzhou and Jiaobei Beach, and the pelagic fish resources were relatively large, and the fish resources were more concentrated in April. Underwater acoustic frequency difference technology can effectively eliminate plankton signals and background noise signals in the water environment, which is of reference significance for fishery acoustic evaluation in the Yangtze River Basin. The results of this study can provide a scientific basis for the accurate assessment of the bait fish resources of the Yangtze finless porpoise in the reserve, support the conservation of the Yangtze finless porpoise in situ, and provide a scientific basis for the conservation of fish resources in the lower Reaches of the Yangtze River. -
鱼类资源评估是进行鱼类资源管理的前提和基础, 科学评估鱼类资源对水生生物保护和生态系统修复具有重要意义[1, 2]。水声学方法是进行鱼类资源调查的重要手段, 其具有采样范围广、不损害渔业资源、低成本及高效性等优点, 可对整个水域进行连续监测, 能够有效地从面上掌握调查水域的鱼类资源现状[3—5]。近年来, 随着水声学硬件和软件的不断提升完善, 采用水声学调查鱼类资源的方法在内陆、近海和大洋水域得到越来越广泛的应用[6, 7]。
水声学频差技术是通过比较目标生物对不同频率声波响应的差异, 完成目标生物识别和量化的一种技术, 主要针对于鱼类和浮游生物的研究, 对特定水生生物资源评估具有重要意义[8—11]。目前, 频差技术已广泛应用于鱼类和浮游生物群体的分类和资源评估[10, 12—14] , 王新良等[14]利用该技术对鱼类和太平洋磷虾(Euphausia pacifica)回波信号进行频差处理, 进而有效识别太平洋磷虾群体信号, 从而准确评估太平洋磷虾的资源密度。长江流域水量大、流速快、船舶多, 通常在水下会形成混响, 产生复杂的背景噪声, 会对鱼类信号产生遮蔽效应, 另外大量聚集的浮游生物也会对鱼类信号产生影响[15], 这符合频差技术的应用原理, 因此将水声学频差技术应用于长江水域, 可有效削弱噪声及浮游生物信号对鱼类信号的影响, 从而准确评估鱼类资源密度。
镇江长江豚类省级自然保护区(以下简称“保护区”)建立于2003年, 位于江苏省镇江市丹徒区和畅洲北汊至润扬大桥下游的长江干流水域, 是长江下游长江江豚(Neophocaena asiaeorientalis asiaeorientalis)重要的生态走廊[16], 也是目前唯一核心区没有被开辟为长江航道的豚类自然保护区, 保护区水域宽阔, 最大水深超过40 m, 水质良好, 渔业资源丰富, 人为干扰少, 是长江江豚栖息生存的优良场所[17]。长江江豚为国家一级重点保护野生动物[18], 位于食物网营养级的顶端, 鱼类资源是影响其分布、活动和生存的主要因素[19], 因此掌握保护区内鱼类资源密度、分布特征及变动趋势对于加强保护区就地保护和栖息地修复具有指导意义。
本研究于2020年春季(4月)和秋季(9月)采用水声学方法(双频科学探鱼仪200和333 kHz)和网具调查方法(多目刺网和虾笼网)同步进行鱼类资源调查, 利用水声学频差技术对镇江长江豚类省级自然保护区的鱼类资源进行声学评估, 分析鱼类的后向散射强度(Volume back-scattering strength, Sv)和目标强度(Target strength, TS)的频差特性, 完成鱼类回波映像的识别, 探讨鱼类物种组成及时空分布特征, 掌握保护区鱼类资源现状, 以期为保护区长江江豚的就地保护工作提供基础数据。
1. 材料与方法
1.1 数据来源
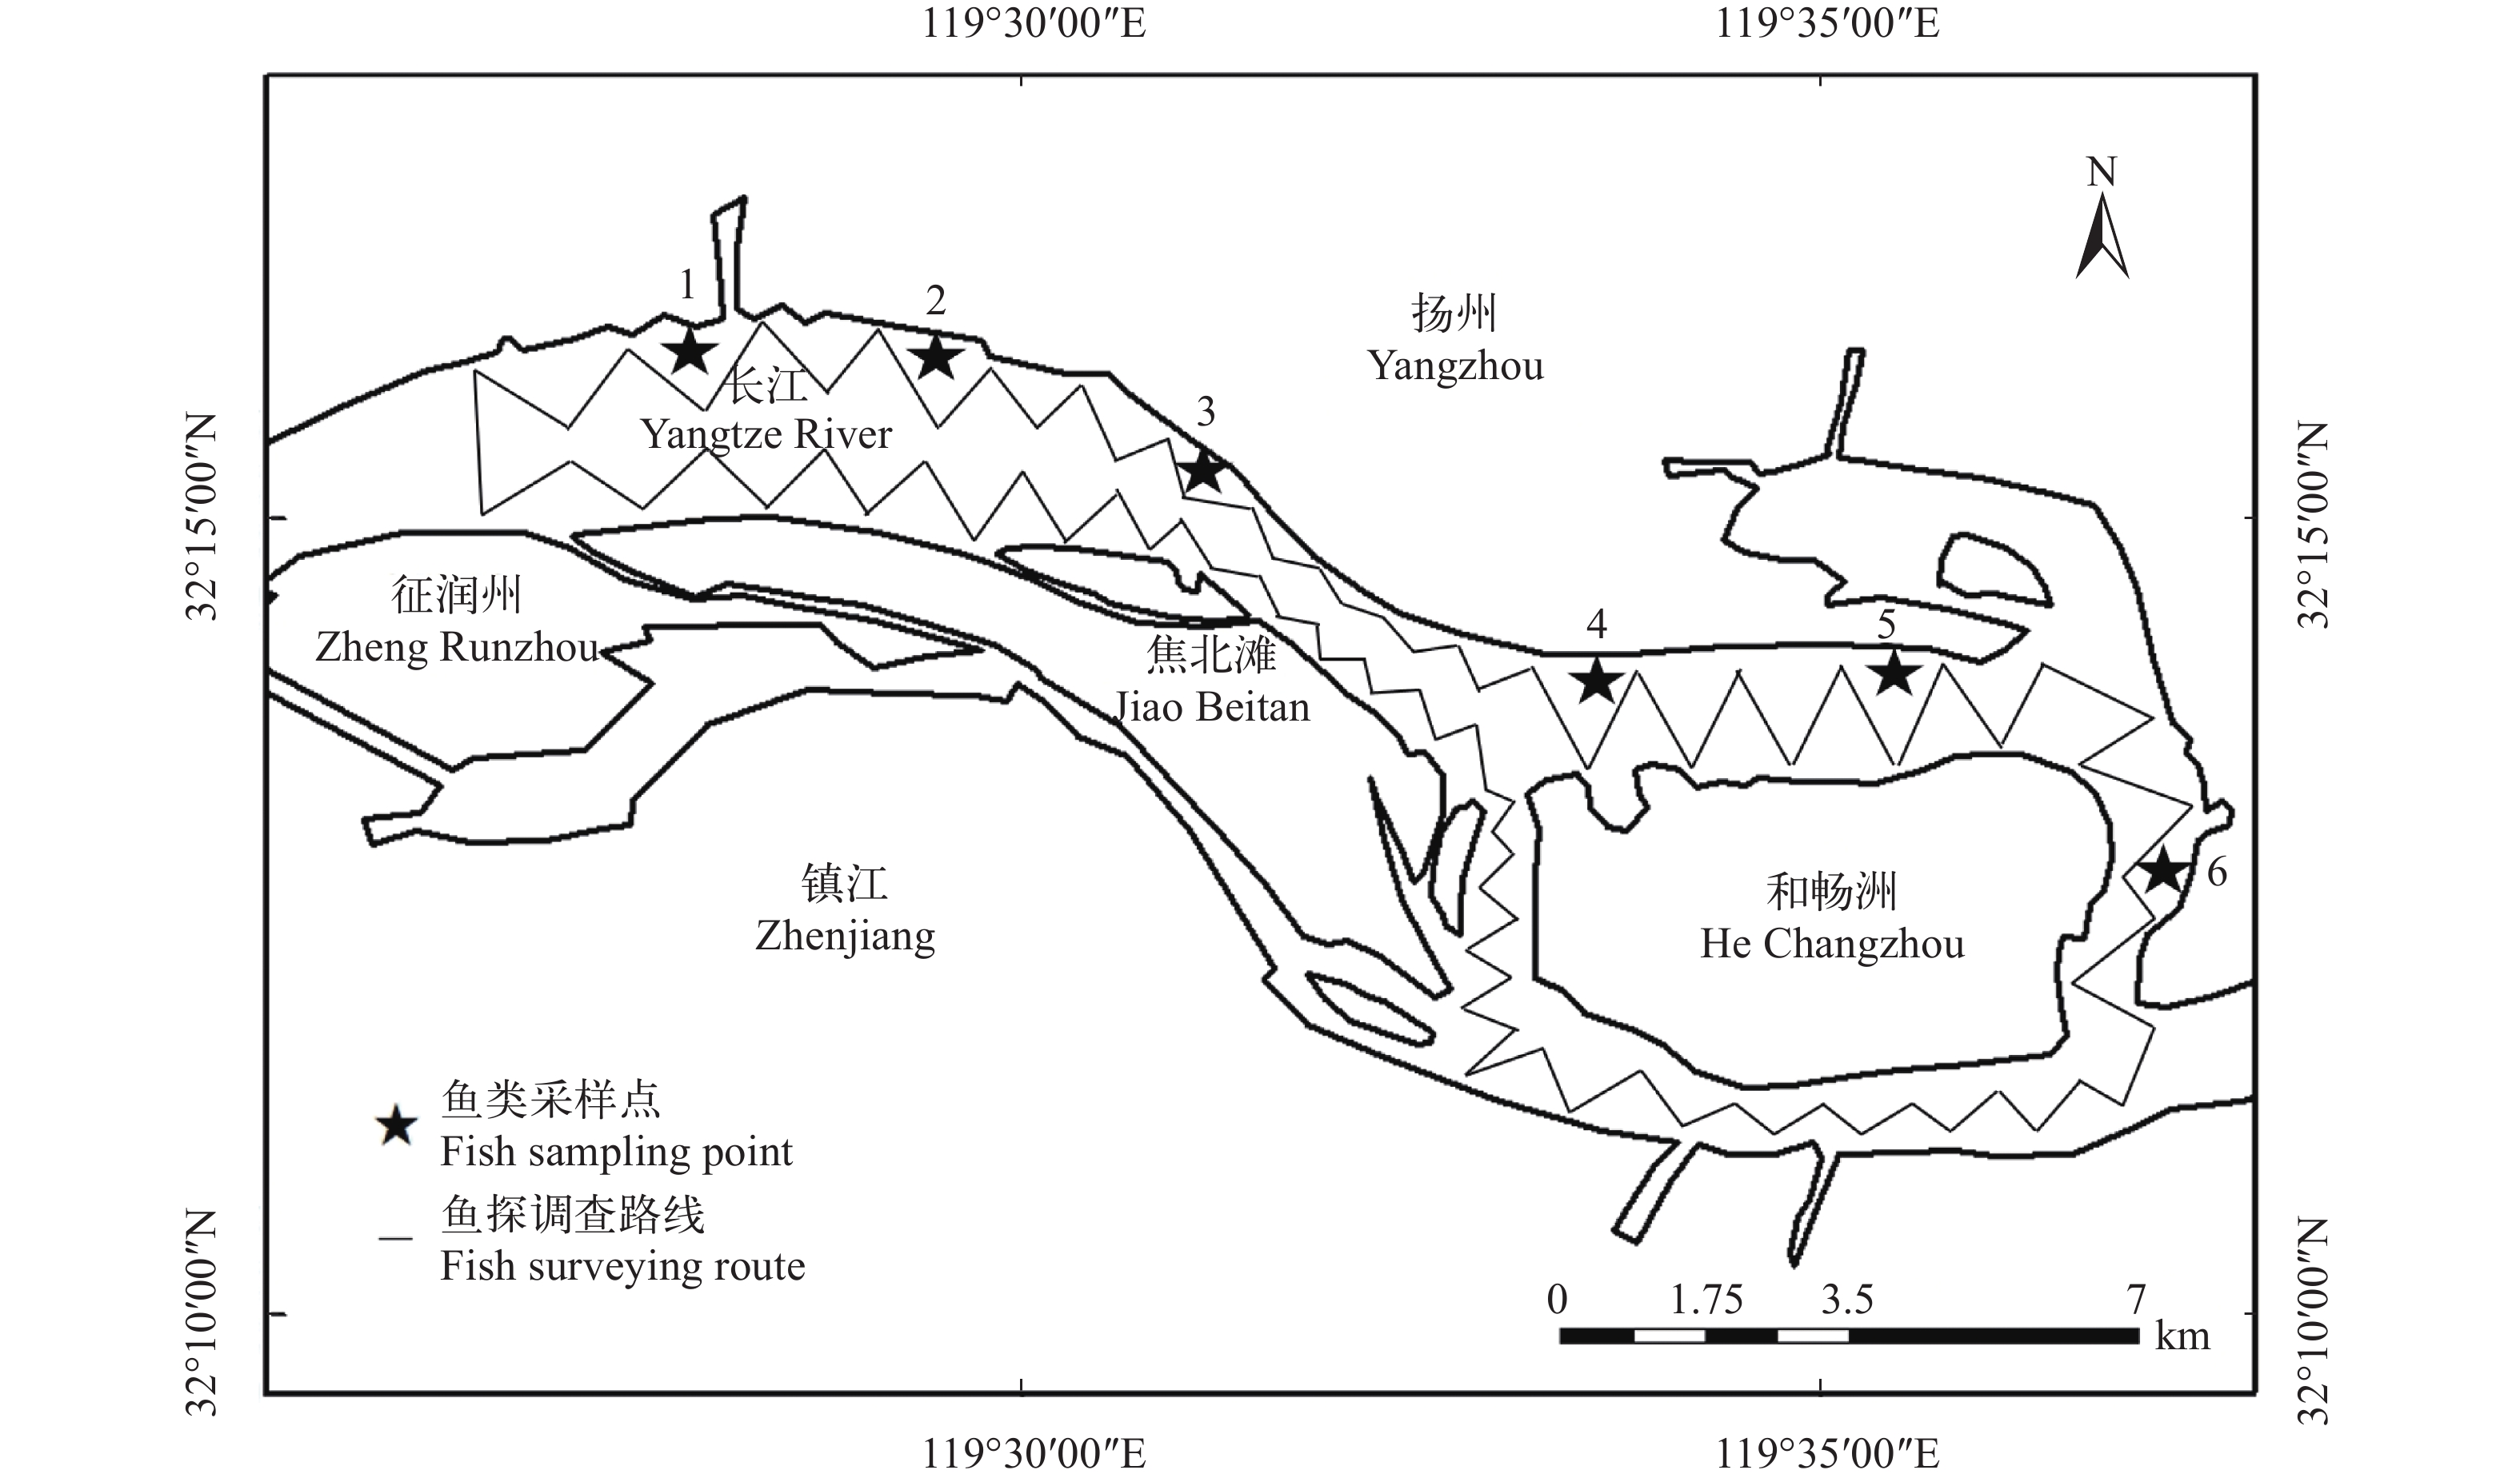
调查水域为镇江长江豚类省级自然保护区(32°11′—32°16′N, 119°25′—119°37′E), 调查时段为2020年4月12—15日和9月2—5日。春季(4月)和秋季(9月)各进行1次水声学和网具调查。水声学调查选择无雨及微风的日间进行, 每个航次用时1d; 网具调查同期进行, 用时3d。调查航线及点位如图 1。
1.2 水声学调查
水声学调查时间分别为2020年4月12日和9月2日8:00—16:00, 春季(4月)和秋季(9月)各进行一次调查, 实验采用两个分裂式波束科学探鱼仪(Simrad EY60, 200 &333 kHz)开展水声学调查, 其换能器通过支架固定于船体的右舷外侧, 入水约0.5 m。利用Simrad EY60系统自带的专用软件ER60采集声学数据, 通过GPS(Garmin GPS 72H)获得动态经纬度信息, 科学探鱼仪的技术参数设置如表 1所示。
表 1 EY60科学探鱼仪的主要技术参数设置Table 1. Main technical parameters setting for scientific echosounder EY60技术参数
Technical parameter参数值Parameter value 4月April 9月September 换能器频率Transducer frequency (kHz) 200 333 200 333 发射功率Transmitted power (W) 150 50 150 50 脉冲持续时间Pulse length (ms) 1.024 1.024 1.024 1.024 换能器增益Transducer gain (dB) 27 24 27 24 数据采集深度Data acquisition depth (m) 80 80 80 80 双向波束角Two-way beam angle (dB) –20.7 –20.7 –20.7 –20.7 长轴3 dB波束角Major-axis 3 dB beam angle (°) 7 7 7 7 短轴3 dB波束角Minor-axis 3 dB beam width (°) 7 7 7 7 声速Sound speed (m/s) 1494.25 1494.25 1506.07 1506.07 吸收系数Absorption coefficient (dB/m) 0.0078 0.0216 0.0069 0.0190 调查水域面积约为44 km2, 江段长度约为32 km。调查船为科学考察船皖当渔指80010(吨位为8 t, 马力为36.3 kW)。由于受到实际航行条件的限制, 在主航道处采用两岸小“之”字型方法进行走航调查, 非主航道处采用大“之”字型方法进行走航调查, 航线长度为76 km左右, 航线覆盖率为11.46(公式1), 声学采样误差小于10%[20, 21], 全程航速保持在8—10 km/h, 航线如图 1所示。调查前按照国际通用的标准目标法对科学探鱼仪进行现场校正[22]。
$ D=\frac{T}{\sqrt{A}} $


(1) 式中, D为航线覆盖率; T为航线距离, 单位为km; A为水域面积, 单位为km2。
1.3 网具调查
网具调查时间为4月13—15日和9月3—5日, 春季(4月)和秋季(9月)各进行1次采样, 每次采样进行3天。采样点位信息如图 1和表 2所示, 两次调查的网具放置位置会有误差, 离岸距离100 m左右, 使用多目刺网和虾笼网进行同步调查, 多目刺网规格为: 网长125 m, 网高1.5 m, 网目尺寸为1.2、2.0、4.0、6.0、8.0、10.0和14.0 cm; 虾笼网规格为: 网长25 m、网宽40 cm、网高40 cm、网目尺寸为1.6 cm。每个采样点放置2条多目刺网和3条虾笼网, 每次放置24h后收网。采集的鱼类现场分类测量并记录鱼类全长、体长(精确到1 mm)、体重(精确到0.1 g)等信息, 对于现场难以鉴定的鱼类, 保存带回实验室参照《中国淡水鱼类检索表》和《江苏鱼类志》进行鉴定。
表 2 网具调查点位信息Table 2. Net survey point information点位
Position坐标
Coordinate水深Depth (m) 4月April 9月September 1 32°16′27.92″N 119°27′45.37″E 5.8 6.6 2 32°16′18.65″N 119°29′23.34″E 6.9 7.7 3 32°15′32.63″N 119°31′06.82″E 4.3 5.1 4 32°14′06.76″N 119°33′28.10″E 2.0 2.5 5 32°14′19.13″N 119°35′34.14″E 5.9 7.3 6 32°13′06.56″N 119°37′31.92″E 13.2 14.5 根据国内外学者的研究成果, 本文将鱼类TS与全长(Total length, TL)或体长(Body length, BL)的关系式总结整理在表 3中, 对于体型相仿的鱼类采用相同的公式。
表 3 不同物种鱼类目标强度计算公式Table 3. Calculation formula of target intensity for different fish物种
Species目标强度计算公式
Calculation formula of target strength鲤 Cyprinus carpio TS=29.84×lgTL–95.23[23] 鳙 Hypophthalmichthys nobilis TS=35.88×lgTL–90.33[23] 鳊 Parabramis pekinensis TS=20.0×lgBL–70.1[24] 鲢 Hypophthalmichthys molitrix TS=20.0×lgBL–67.0[24] 鲇 Silurus asotus TS=20.0×lgTL–74.5[24] 闭鳔类 Physocilists TS=20.0×lgTL–67.4[25] 其他 Others TS=19.1×lgTL–63.9[26] 注: 表中TS为目标强度; TL为鱼体全长; BL为鱼体体长; 其他包括鲱形目、鲤形目、刺鱼目、鳉形目、鲻形目、鳕形目、金眼鲷目、鲈形目Note: TS is the target strength; TL is the fish total length; BL is fish body length; others include Clupeiformes, Cypriniformes, Gasterosteiformes, Cyprinodontiformes, Mugiliformes, Gadiformes, Beryciformes and Perciforme 1.4 声学数据的处理及频差分析
声学数据采用专用声学软件Echoview 4.9进行处理分析。通过设置回波积分起始线(水面下1.5 m)剔除航行时螺旋桨产生的气泡和波浪噪声, 通过设置回波积分终止线(水底上0.5 m)剔除特殊地形、底部植被回波和某些干涉信号噪声。积分阈值设置为–65 dB, 可去除大部分的背景噪声信号, 保留鱼类信号, 对于江面和江底存在的明显背景噪声需手动剔除。根据回波映像积分值的分布设置基本积分航程单元(Elementary Distance Sampling Unit, EDSU), 水平方向为500 m、垂直方向为70 m, 用来统计分析鱼类资源的空间分布特征。
利用Echoview软件中的虚拟变量模块进行频差分析, 通过Linear minus算法用333 kHz减去200 kHz的Sv回波数据, 主要去除鱼类信号, 获得浮游生物及背景噪声的回波信号(Sv噪声=Sv333–Sv200); 再运行一次Linear minus算法, 用200 kHz减去Sv噪声的回波图, 去除200 kHz回波数据中Sv噪声信号, 即可获得清晰的鱼类Sv回波映像图(Sv鱼类= Sv200–Sv噪声)。以同样的方法得到鱼类TS回波映像图。然后对鱼类回波数据进行单体目标检测和单体目标轨迹追踪, 其中的参数设置如表 4所示。
表 4 单体目标检测的参数设置Table 4. Parameter setting of the single target detection技术参数
Technical parameter参数值
Parameter valueTS阈值TS threshold (dB) –65.00 脉冲长度测定值Pulse length determination level (dB) 6.00 最小标准脉冲长度Minimun normalized pulse length 0.20 最大标准脉冲长度Maximun normalized pulse length 1.50 波束补偿模型Beam compensation model Simrad LOBE 最大波束补偿Maximun beam compensation (dB) 4.00 短轴角的最大标准偏差Maximum standard deviation of minor-axis angles (°) 0.60 长轴角的最大标准偏差Maximum standard deviation of major-axis angles (°) 0.60 本研究主要关注长江鱼类的回波信号, 根据长江中多次科学探鱼仪调查研究发现, 受水体内浮游生物、泥沙和水流混响等噪声信号影响, 200 kHz的探测效果比分辨率更高的333 kHz更理想。本研究使用频差技术目的是提升使用200 kHz所探测数据的评估精度, 故使用333 kHz减去200 kHz将噪声信号提取出来, 再在200 kHz的回波基础上减去噪声信号以达到降噪并提升精度的目的。
1.5 鱼类资源的统计分析
采用回波积分法对保护区鱼类资源进行声学评估, 并分析其分布特征和时空差异。根据鱼类单体检测结果, 获得积分单元中鱼类的TS均值, 将Sv回波映像数据以积分单元方式导出, 获得积分单元中的声学积分值(Area backscattering coefficient, ABC, m2/m2), 根据公式(2)和(3)即可计算出鱼类总体的资源密度(尾/m2)[27]。
$ \rho = \frac{ABC}{{\sigma }_{{\rm{bs}}}} $


(2) $ {\sigma }_{{\rm{bs}}} = {10}^{\frac{{\rm{TS}}}{10}} $


(3) 式中, ρ为鱼类资源的平均面积密度, 单位为尾/m2; ABC为平均面积后向散射系数, 单位为m2/m2; σbs为所有生物的平均后向散射截面, 单位为m2; TS为鱼类的平均TS, 单位为dB。
根据鱼类单体检测结果, 分别获得TS频数分布和TS水深分布数据, 进而对鱼类TS的空间分布特征进行讨论分析, 并以10 m水深为间隔计算各水层鱼类声学积分值, 分析保护区内鱼类资源的垂直分布特征。数据的差异分析采用独立样本T检验, P<0.05为差异显著, P<0.001为差异极显著, 否则无显著性差异。
2. 结果
2.1 频差技术处理前后的回波映像分析
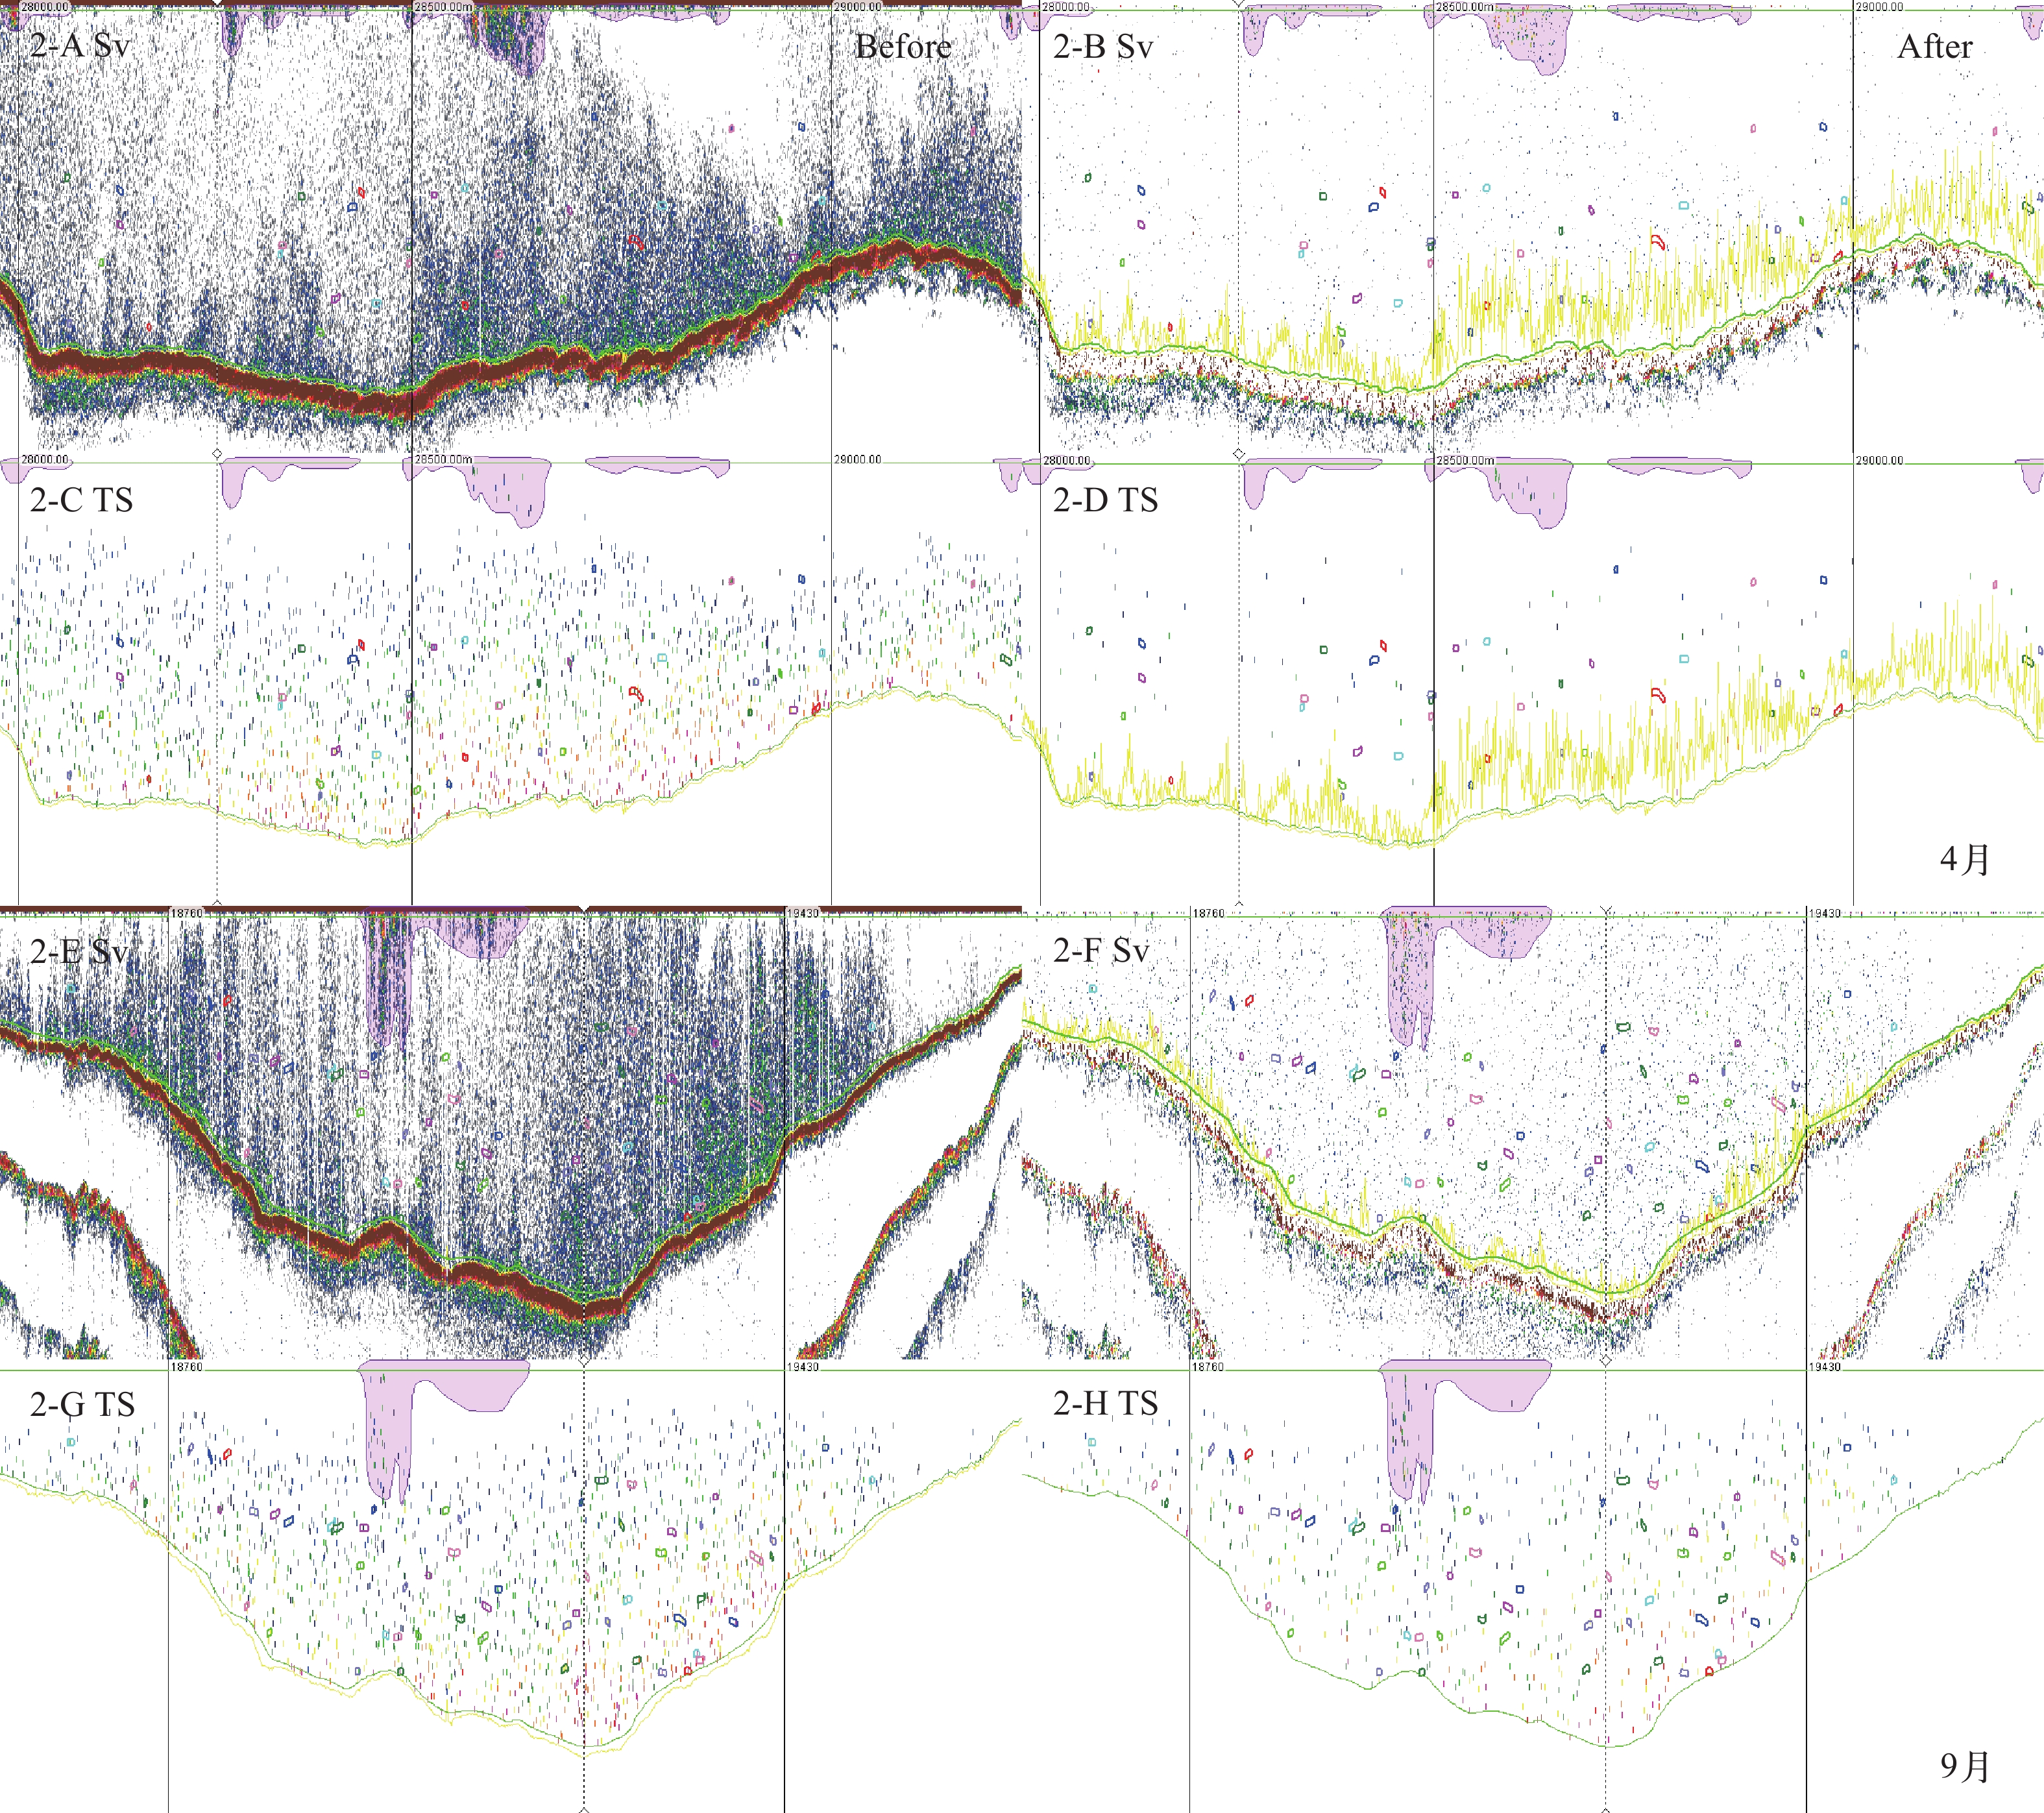
2020年4月和9月保护区水域的200 kHz回波映像如图 2所示, 图中A和E、B和F分别表示频差技术处理前后的Sv回波映像图, C和G、D和H分别表示频差技术处理前后的单体目标检测TS回波映像图。其中小圆圈代表鱼类轨迹追踪所得到的鱼类单体信号, 图 2B和图 2D中黄色的折线是333 kHz科学探鱼仪默认的水体底部线。
![]() 图 2 保护区4月和9月鱼类200 kHz回波映像图A和E为频差技术处理前的Sv回波图; B和F为频差技术处理后的Sv回波图; C和G为频差技术处理前的单体目标检测TS回波图; D和H为频差技术处理后的单体目标检测TS回波图; 其中圆圈符号表示为鱼类轨迹追踪到的鱼类信号; 不规则的粉色圈表示bad date, 不进行计算Figure 2. The echograms of fish with 200 kHz in Reserve in April and SeptemberA and E are the echogram of Sv before frequency difference technique processing; B and F are the echogram of Sv after frequency difference technique processing; C and G are the echogram of Ts during single target detection before frequency difference technique processing; D and H are the echogram of Ts during single target detection after frequency difference technique processing; the circle symbol represents the fish signal tracked by the fish track; the irregular pink circles indicate bad dates and are not calculated
图 2 保护区4月和9月鱼类200 kHz回波映像图A和E为频差技术处理前的Sv回波图; B和F为频差技术处理后的Sv回波图; C和G为频差技术处理前的单体目标检测TS回波图; D和H为频差技术处理后的单体目标检测TS回波图; 其中圆圈符号表示为鱼类轨迹追踪到的鱼类信号; 不规则的粉色圈表示bad date, 不进行计算Figure 2. The echograms of fish with 200 kHz in Reserve in April and SeptemberA and E are the echogram of Sv before frequency difference technique processing; B and F are the echogram of Sv after frequency difference technique processing; C and G are the echogram of Ts during single target detection before frequency difference technique processing; D and H are the echogram of Ts during single target detection after frequency difference technique processing; the circle symbol represents the fish signal tracked by the fish track; the irregular pink circles indicate bad dates and are not calculated从鱼类的回波映像图中可以明显看出, 在进行频差技术处理前数据中包含大量的噪声信号(如图 2A和2E), 其中可能混合有浮游生物的回波、水流波浪及水下背景噪声信号, 并呈现散点状或斑块状分布, 使得鱼类信号被遮蔽, 因而无法对噪声中的鱼类进行准确地资源评估。采用频差技术处理后, 大部分的噪声信号被剔除, 以获得较清晰的Sv回波映像图(如图 2B和图 2F所示)及单体TS回波映像图(如图 2D和图 2H所示), 保留被遮蔽的鱼类信号, 从而有效地提高鱼类资源密度评估的准确性。
频差技术处理前后的声学参数变化如表 5所示, 结果表明在进行频差技术处理后的回波映像中Sv均值显著变小(P<0.05), 而TS均值稍变大, 但变化不显著(P>0.05)。这说明频差技术可以有效地消除噪声和浮游生物所产生的声学积分值, 而对鱼类单体TS检测的影响较小。
表 5 频差技术处理前后的保护区鱼类声学参数Table 5. Acoustic parameters of fish in reserve before and after frequency difference technique时间
Time频差技术
Frequency difference techniqueSv均值
Mean value of Sv (dB)TS均值
Mean value of TS (dB)4月April 处理前 –72.51±2.90 –58.41±3.78 处理后 –84.51±4.69* –57.26±4.26 9月September 处理前 –69.74±3.60 –55.92±3.93 处理后 –78.54±3.15* –55.57±4.03 注: 表中*代表两组数据间具有显著差异(0.001<P<0.05)Note: Sign* in the table represents significant difference between the two groups (0.001<P<0.05) 2.2 鱼类物种组成及声学评估
网具调查共采集鱼类758尾、53.53 kg, 鉴定鱼类种类达48种, 隶属于6目12科33属(表 6)。物种组成以鲤形目(Cypriniformes)鱼类占优, 共19属27种, 占总物种数的55.10%, 其数量和质量占比分别为44.31%和81.23%; 鲇形目(Siluriformes)和鲱形目(Clupeiformes)鱼类的数量占比分别为22.09%和21.83%, 仅次于鲤形目。季节间比较, 4月鱼类物种数、数量和平均体长均小于9月。此外, 保护区水域中上层鱼类群体数量和质量占比分别为36.15%和66.12%, 长江江豚饵料鱼类(体长小于20 cm、体高小于6 cm、体重小于100 g的中上层鱼类)[28, 29]数量和质量占比分别为23.22%和8.72%。
表 6 保护区渔获组成及声学评估Table 6. Fish composition and acoustical assessment in Reserve分类阶元
Taxonomic category数量(尾)
Quantity体长均值
Body length (cm)体质量均值
Quality (g)目标强度TS
Target strength (dB)4月Apr. 9月Sep. 4月Apr. 9月Sep. 4月Apr. 9月Sep. 4月Apr. 9月Sep. Ⅰ 鲱形目Clupeiformes ⅰ 鳀科Engraulidae 1 刀鲚Coilia nasus Temminck et Schlegel 73 22.63 37.2 –37.34 2 短颌鲚Coilia brachygnathus Kreyenberg et Pappenheim 35 57 19.23 19.17 27.7 27.6 –38.62 –38.74 Ⅱ 鲤形目Cypriniformes ⅱ 胭脂鱼科Catostomidae 3 胭脂鱼Myxocyprinus asiaticus (Bleeker) 1 11.69 41.8 –47.63 ⅲ 鲤科Cyprinidae 4 草鱼Ctenopharyngodon idella (Valenciennes) 3 34.71 857.9 –33.17 5 青鱼Mylopharyngodon piceus (Richardson) 1 7.47 6.3 –55.55 6 赤眼鳟Squaliobarbus curriculus (Richardson) 5 13.93 42.4 –46.03 7 翘嘴鲌Culter alburnus Basilewsky 1 18.45 62.2 –41.47 8 蒙古鲌Culter mongolicus (Basilewsky) 1 35.95 583.6 –31.79 9 红鳍原鲌Cultrichthys erythropterus (Basilewsky) 4 8.63 8.8 –53.85 10 贝氏䱗Hemiculter bleekeri Warpachowski 14 5 8.85 9.44 9.3 10.3 –52.79 –52.60 11 团头鲂Megalobrama amblycephala Yih 2 26.92 435.2 –41.50 12 鲂Megalobrama skolkovii Dybowsky 3 9.75 21.1 –50.32 13 鳊Parabramis pekinensis (Basilewsky) 17 45 21.31 24.83 202.5 281.8 –43.53 –42.20 14 似鳊Pseudobrama simoni (Bleeker) 39 21 12.73 11.71 39.0 28.3 –47.45 –48.97 15 银鲴Xenocypris argentea Günther 23 16.55 119.7 –43.20 16 鳙Hypophthalmichthys nobilis (Richardson) 6 32.81 1298.6 –33.46 17 鲢Hypophthalmichthys molitrix (Valenciennes) 1 54.65 3478.0 –32.25 18 棒花鱼Abbottina rivularis (Basilewsky) 1 4.83 1.4 –62.79 19 花䱻Hemibarbus maculatus Bleeker 2 3 18.63 22.66 116.3 187.7 –42.30 –38.82 20 麦穗鱼Pseudorasbora parva (Temminck et Schlegel) 1 6.10 3.6 –59.19 21 黑鳍鳈Sarcocheilichthys nigripinnis (Günther) 3 7.74 80.3 –55.94 22 华鳈Sarcocheilichthys sinensis Bleeker 1 12.44 46.0 –48.10 23 蛇Saurogobio dabryi Bleeker 9 59 14.38 8.95 29.0 12.1 –46.46 –53.62 24 长蛇Saurogobio dumerili Bleeker 1 10 18.70 20.80 47.5 76.8 –42.59 –40.89 25 光唇蛇Saurogobio gymnocheilus Lo, Yao et Chen 2 7.87 3.8 –56.10 26 银Squalidus argentatus (Sauvage et Dabry) 14 21 6.46 6.78 3.8 5.1 –59.82 –57.50 27 兴凯鱊Acheilognathus chankaensis (Dybowsky) 2 5.28 4.0 –55.64 28 斑条鱊Acheilognathus taenianalis Günther 5 7.12 10.5 –57.45 29 鲫Carassius auratus auratus (Linnaeus) 5 2 13.26 6.41 68.6 37.9 –58.83 –68.17 30 鲤Cyprinus carpio Linnaeus 2 37.43 1010.3 –46.66 ⅳ 鳅科Cobitidae* 31 紫薄鳅Leptobotia taeniaps (Sauvage) 1 7.45 5.2 32 武昌副沙鳅Parabotia banarescui (Nalbant) 1 9.37 5.4 33 花斑副沙鳅Parabotia fasciata Dabry Guichenot 1 6.00 1.2 34 泥鳅Misgurnus anguillicaudatus (Cantor) 1 2 15.23 12.56 27.4 12.6 Ⅲ 鲇形目Siluriformes ⅵ 鲿科Bagridae 35 长吻Leiocassis longirostris Günther 5 10.64 44.3 –53.96 36 黄颡鱼Pelteobagrus fulvidraco (Richardson) 1 4 19.42 11.26 128.3 33.3 –39.29 –53.47 37 光泽黄颡鱼Pelteobaggrus nitidus (Sauvage et Dabry) 9 129 14.63 8.43 46.4 9.2 –51.19 –55.98 38 瓦氏黄颡鱼Pelteobagrus vachelli (Richardson) 3 16 15.92 7.43 33.6 5.3 –50.46 –57.08 ⅴ 鲇科Siluridae* 39 鲇Silurus asotus Linnaeus 1 12.22 16.7 40 南方鲇Silurus meridionalis Chen 1 20.70 87.3 Ⅳ 鲈形目Perciformes ⅶ 鮨科Serranidae 41 中国花鲈Lateolabrax maculatus (McClelland) 3 18.75 272.2 –40.76 42 鳜Siniperca chuatsi (Basilewsky) 1 17.57 112.7 –43.01 43 大眼鳜Siniperca kneri Garman 5 4 14.54 9.37 74.7 16.5 –45.66 –52.70 ⅷ 䲗科Callionymidae* 44 香斜棘䲗Repomucenus olidus Günther 1 3.59 0.6 ⅹ 塘鳢科Eleotridae * 45 尖头塘鳢Eleotris oxycephala Temminck et Schlegel 1 15.42 54.9 ⅸ 虾虎鱼科Gobiidae* 46 子陵吻虾虎鱼Rhinogobius giurinus (Rutter) 57 4.74 2.5 Ⅴ 鲽形目 Pleuronectiformes* xi 舌鳎科Cynoglossidae 47 窄体舌鳎Cynoglossus(Areliscus) gracilis Günther 3 4 27.35 23.21 95.5 73.3 Ⅵ 鳗鲡目Anguilliformes* xii 鳗鲡科Anguillidae 48 鳗鲡Anguilla japonica Temminck et Schlegel 2 15.49 75.5 注: 表中*物种为底栖生物, 不进行声学评估Note: Sign* in the table are benthic and no acoustical assessment is performed 结合鱼类网具调查数据进行声学评估, 不考虑鳅科、鲇科、䲗科、虾虎鱼科、塘鳢科、舌鳎科和鳗鲡科等底栖物种(表 6)。4月和9月采集的鱼类中体型较大的鱼类(如青鱼、草鱼、鲢、鳙、鲌类和鳊等)TS相对较大, 而体型较小的鱼类(如棒花鱼、银、鱊和鲫等)TS相对较小。
2.3 鱼类单体目标强度特征
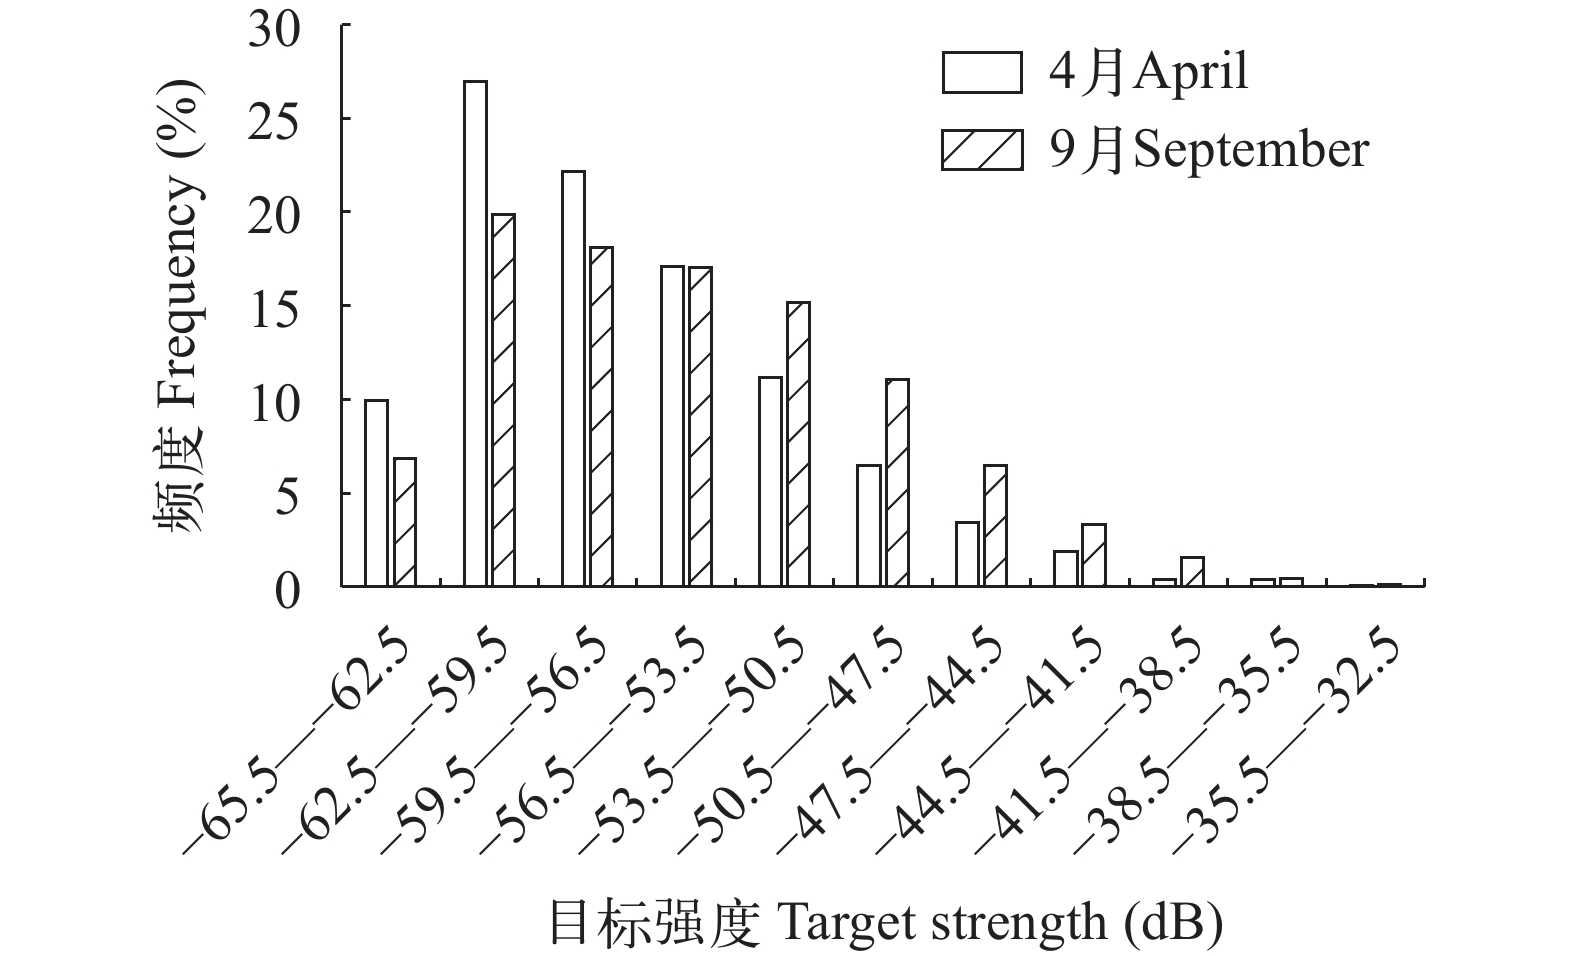
鱼类目标强度是将回波积分值转换为资源量的关键参数, 对鱼类资源声学评估具有重要意义[23, 24]。通过Echoview 4.9软件的单体检测和鱼类轨迹追踪功能, 输出鱼类单体TS数据, 以获得鱼类TS频数分布特征(图 3)。随着TS值增加, 鱼类单体频数呈现先增加后减少的变化趋势, 保护区鱼类TS均值为(–57.33±5.69) dB, 单体TS主要分布在–65.0— –38.5 dB, 其中TS在–62.5— –50.5 dB的鱼类数量最多, 占比达73.80%, 对应鱼类体长约为5.97—10.63 cm, 表明保护区水域小型鱼类数量占据优势。
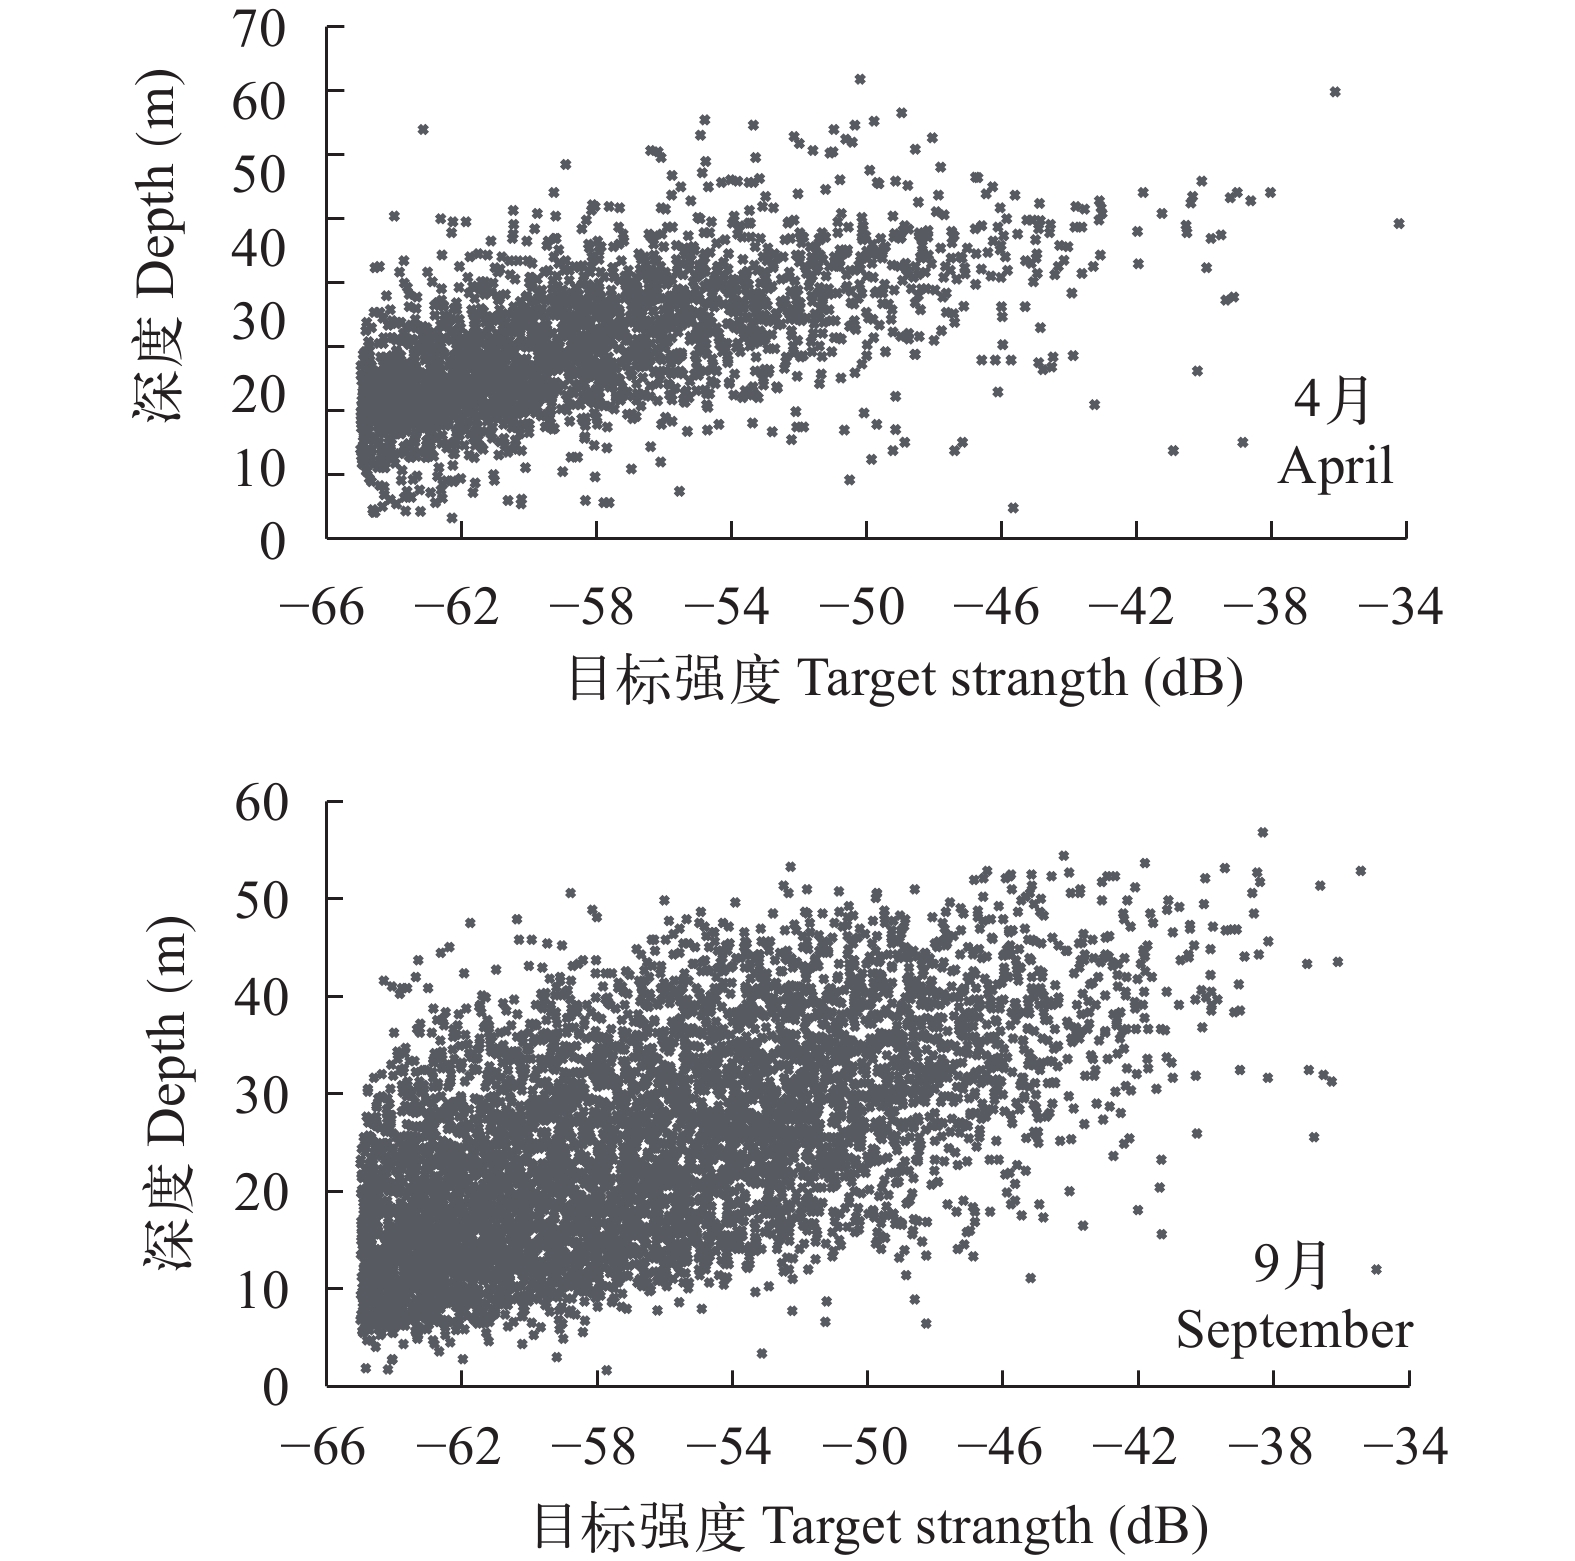
对鱼类TS的垂直分布进行统计分析(图 4), 鱼类TS信号主要分布在5—50 m, 10、20、30、40、50 和60 m水层处的TS均值分别为–59.5、–57.3、–55.3、–51.0、–46.7和–46.1 dB, 随着深度增加, 鱼类TS均值逐渐变大, 表明保护区鱼类个体大小与深度呈正相关关系。保护区小型鱼类在垂直方向上主要分布在5—30 m水深范围内。
2.4 鱼类资源时空分布特征
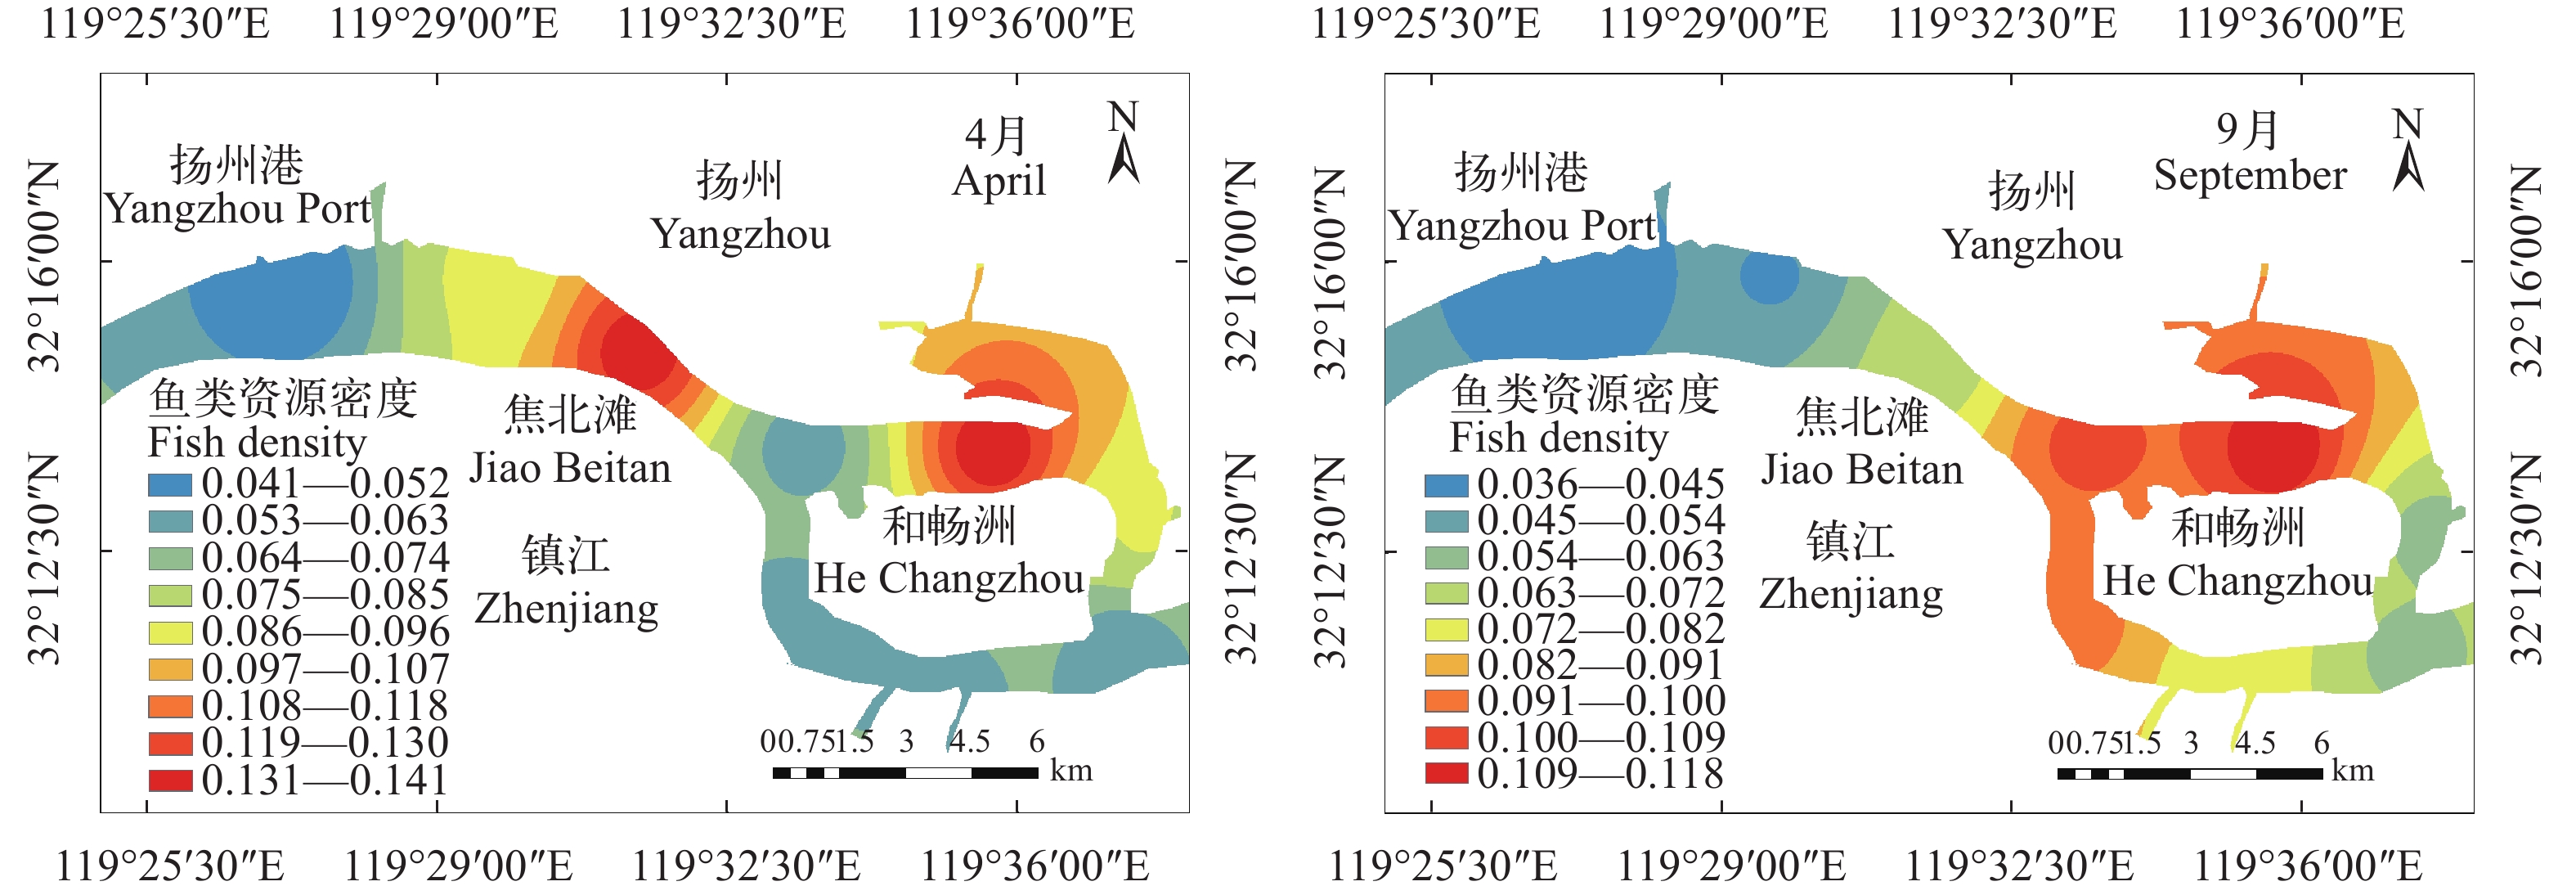
调查结果显示, 保护区鱼类资源密度均值为(0.094±0.183) 尾/m2, 鱼类资源分布存在显著的时空特征。就时间特征而言, 4月和9月的鱼类资源密度均值分别为(0.096±0.216)和(0.089±0.044) 尾/m2, 差异不显著(P>0.05), 但4月鱼类种群分布更集中(图 5)。4月和9月鱼类TS均值分别为–57.26和–55.57 dB, 存在显著性差异(P<0.05), 表明9月鱼类体长均值大于4月(图 3)。
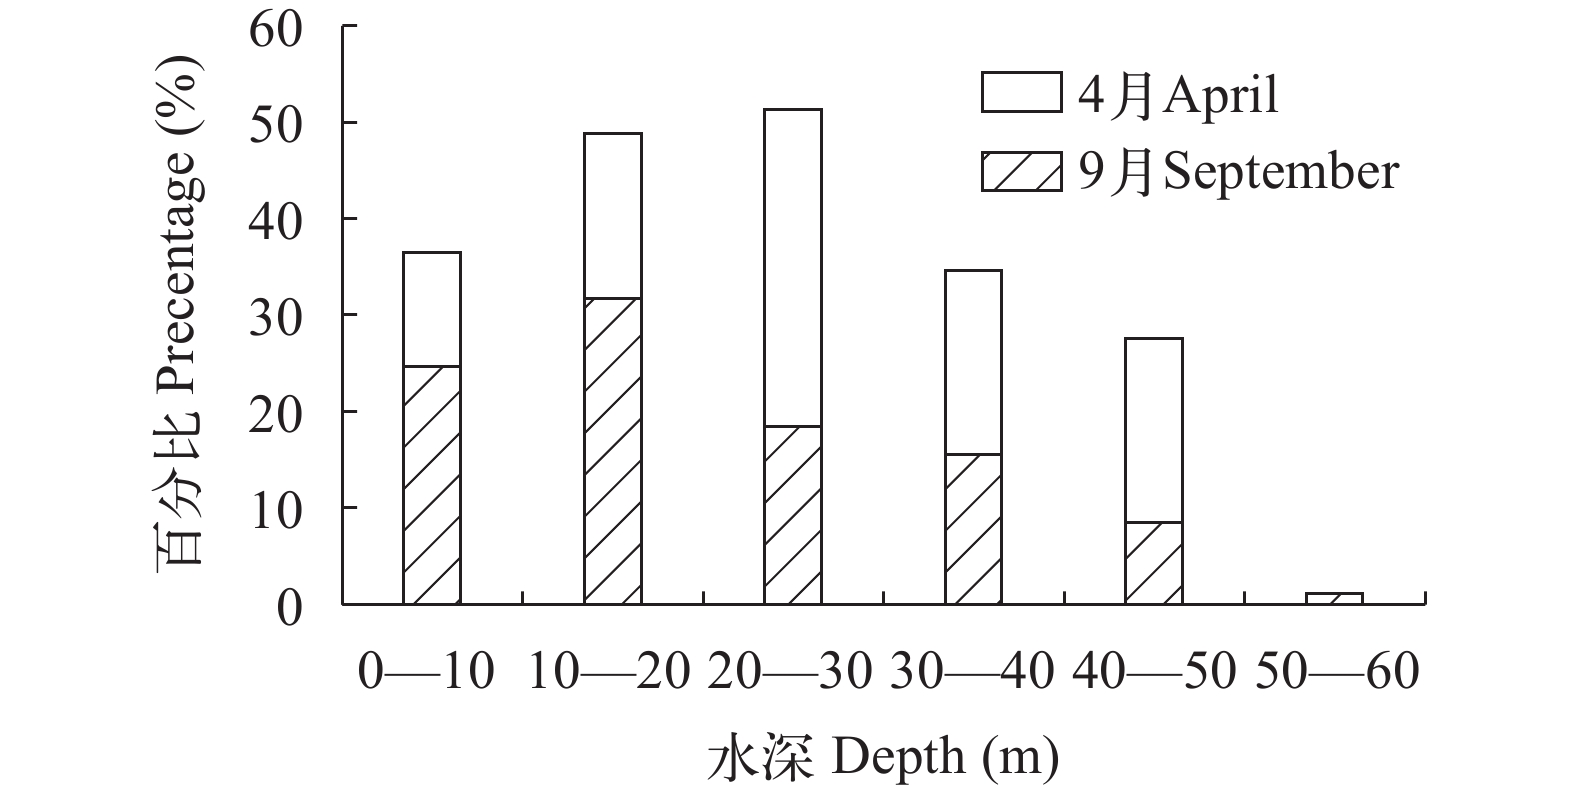
就空间特征而言, 水平方向上, 保护区鱼类主要集中分布于和畅洲北汊和焦北滩附近水域, 资源密度均值分别为0.129和0.102尾/m2, 变幅为0.086—0.141尾/m2; 北岸扬州港附近水域鱼类分布最少, 资源密度均值为0.038尾/m2, 变幅为0.036—0.052尾/m2(图 5)。垂直方向上, 声学积分值(Area backscattering coefficient, ABC, m2 /m2)在0—50 m水深范围内均有分布, 而主要分布于0—30 m, 占比为68.31%(图 6), 在30 m水深以下, 随着深度增加, 声学积分值的分布逐渐减少。
根据2020年在保护区进行的长江江豚科学考察结果显示, 保护区内约有长江江豚20—30头, 主要集中分布于和畅洲北汊及焦北滩水域附近, 且不同水期存在差异显著的活动迁移规律。2020年4月观测长江江豚7群次18头次, 其中和畅洲北汊12头次, 焦北滩6头次; 和畅洲北汊和焦北滩水域鱼类资源密度均值分别为0.141和0.139尾/m2, 采集的中上层小型鱼类(体长小于20 cm)数量占比分别为15.44%和15.09%。2020年9月观测长江江豚8群次25头次, 其中和畅洲北汊10头次, 焦北滩5头次, 征润州10头次; 和畅洲北汊和焦北滩水域鱼类资源密度均值分别为0.118和0.065尾/m2, 采集的中上层小型鱼类(体长小于20 cm)数量占比为11.76%和9.30%。
3. 讨论
3.1 利用水声学频差技术评估鱼类资源密度的可行性
利用水声学方法对鱼类资源量及种群变动进行评估, 是渔业资源研究领域的重要内容[15]。目前, 水声学频差技术相关研究大多应用于海洋生物的资源评估[14, 30], 其原理是通过比较目标生物对不同频率声波响应的差异, 将其呈现到回波映像图中, 完成目标生物的识别和量化[8-11], 该技术在浮游生物和鱼类资源评估中应用最广泛[12-14]。长江流域具有独特的环境特征, 其水量大、流速快、来往船只频繁, 通常在水下会形成混响, 产生复杂的背景噪声[15]。在采用单频科学探鱼仪进行资源评估时, 通常采用调整积分阈值和手动剔除两种方法处理回波图像中的噪声信号, 当鱼类信号夹杂在浮游生物及噪声信号中时, 传统方法通常无法直接提取鱼类信号, 容易将鱼类信号同噪声信号一同去除, 导致获取鱼类信号数量减少; 而当分贝值较小的“噪声信号”过多时, 获取的单体TS值将比鱼类信号的TS值偏小, 从而导致评估结果有所偏差[31]; 本研究利用双频科学探鱼仪(两个换能器分别发射200和333 kHz声波)对镇江长江豚类省级自然保护区鱼类资源进行声学评估, 采用水声学频差技术通过Echoview后处理系统的线性函数Linear minus算法, 将不同频率的回波映像进行频差处理, 使得Sv均值显著变小(P<0.05, 表 5), 可以有效剔除背景噪声信号和浮游生物信号, 保留被遮蔽的鱼类信号(图 2), 且频差技术对于鱼类TS的影响较小(表 5), 从而可有效提高鱼类资源评估结果的准确性[31]。因此, 在长江干流这类噪声影响比较明显的水域, 利用水声学频差技术进行鱼类资源评估是相对有效的方法。但频差技术在鱼类资源种类组成评估方面与单频测量同样存在不足, 因为体型相仿的鱼类反射的回波比较相似, 且对于不同鱼类TS测量的研究较少, 以目前的技术条件尚无法对鱼类进行精确的分类及资源评估[9]。
网具调查可以掌握保护区水域鱼类种类组成及其规格参数, 可以对声学调查数据进行补充和佐证, 从而更准确地掌握保护区鱼类群落特征。将水声学和网具调查方法相结合, 可以有效评估保护区鱼类资源状况及时空特征。
3.2 基于水声学调查的保护区鱼类资源现状
本研究通过双频科学探鱼仪结合网具调查方法对保护区鱼类资源进行声学评估, 资源密度及TS值等研究结果相比均低于鄱阳湖湖口[32]、长江中游洪湖至宜昌江段[33]、长江上游江段[34]等长江流域的类似调查结果, 这基本上反映了长江下游干流在长江流域重点水域全面禁捕之前, 因水环境污染、江湖阻隔、涉水工程建设、过度捕捞等人类活动影响[35]导致的鱼类等水生生物资源急剧衰退的现实状况。
因受到禁捕管理要求及航运船舶限制, 网具调查主要位于近岸水域, 其数量特征并不能代表整个保护区水域, 其主要目的是掌握保护区鱼类种类组成和规格参数。与水声学调查结果结合分析, 可以更全面地对鱼类资源进行评估。就时间特征而言, 针对保护区水域整体分析, 鱼类资源密度在4月和9月无显著差异(P>0.05)。TS小于–56.5 dB的鱼类在4月分布相对较多, TS大于–56.5 dB的鱼类在9月分布相对较多, 与之对应4月鱼类的TS均值小于9月, 这与网具调查结果相符, 显示了鱼类随时间生长的特征。与2015年曹过等[36]对于此保护区的网具调查结果相比, 鱼类物种数变化不大, 而质量小于50 g的小型鱼类数量占比增多, 这可能是自2018年逐步推进实施的长江重点水域全面禁捕工作逐步发挥作用, 有效保护了鱼类繁殖群体的体现。就空间特征而言, 在水平方向上保护区鱼类分布差异明显, 呈现斑块状分布, 和畅洲北汊鱼类资源分布最集中, 这是因为和畅洲北汊为非通航水域, 沿岸基本为自然岸线, 适合鱼类栖息繁殖; 在垂直方向上, 水深5—30 m鱼类资源分布最集中, 且多为小型鱼类, 表明保护区水域中上层鱼类资源比较丰富, 适合长江江豚捕食的鱼类占比较多。
3.3 保护区鱼类资源与长江江豚分布的相关性
保护区内长江江豚集中分布水域与鱼类集中分布水域总体一致, 均主要为和畅洲北汊和焦北滩附近水域。4月鱼类资源分布较集中, 在和畅洲北汊和焦北滩处密度高于9月, 而4月观测到的长江江豚全部分布在和畅洲北汊和焦北滩处; 9月鱼类资源分布较分散, 观测到的长江江豚除了和畅洲和焦北滩处, 在征润州处也有分布; 另外4月在和畅洲和焦北滩处观测到的长江江豚数量略多于9月。这表明鱼类资源由4—9月集中分布范围逐渐变广, 观测到的长江江豚集中分布范围也在逐渐扩大, 充分说明长江江豚的分布特征及活动迁移规律与鱼类资源的分布密切相关。这与王崇瑞等[19]关于东洞庭湖长江江豚与鱼类资源分布的研究结果一致。鱼类资源分布的时空变化与长江水位、鱼类洄游育肥和生境类型等因素有关[37], 鱼类多集群分布于以自然岸坡为主的水域, 利于长江江豚捕食, 保护区水位由4—9月逐渐上涨, 使得自然岸坡逐渐扩大, 鱼类的食物资源逐渐变多, 范围逐渐变广, 这应为保护区长江江豚与鱼类分布密切相关的主要原因。
镇江长江豚类省级自然保护区是长江下游最末端的豚类保护区, 是长江下游长江江豚重要的生态廊道和聚集区, 具有重要的生态功能和迫切的保护需求, 开展鱼类资源评估, 摸清鱼类资源状况对于加强保护区豚类保护和栖息地修复具有指导意义。
3.4 开展水声学频差技术评估鱼类资源的意义
长江是世界上水生生物多样性最为丰富的河流之一, 也是维护我国生态安全的重要屏障[35]。作为扭转长江流域渔业资源急剧衰退的重要措施, 自2021年1月1日零时起, 长江流域重点水域开始全面禁捕[38]。在此背景下, 针对镇江长江豚类自然保护区水域开展鱼类资源评估, 掌握保护区鱼类资源家底及变动特征, 一方面可以为长江禁捕效果提供技术支持[39], 另一方面可以为保护区科学管护和生态修复提供数据支撑, 对于强化敏感水域的长江江豚就地保护工作具有重要意义。结果表明, 在类似于长江下游干流的背景噪声较为复杂的水域, 水声学频差技术可有效应用于鱼类资源评估; 同时, 在长江流域重点水域全面禁捕的背景下, 相比传统的网具调查, 水声学技术具有不接触、无损伤等优点, 可以在后续的鱼类调查中发挥重要作用。下一步应着重开展提高水声学频差技术对鱼类资源评估精度的研究, 以期为长江流域鱼类资源养护和长江江豚保护工作提供有力支撑。
-
图 2 保护区4月和9月鱼类200 kHz回波映像图
A和E为频差技术处理前的Sv回波图; B和F为频差技术处理后的Sv回波图; C和G为频差技术处理前的单体目标检测TS回波图; D和H为频差技术处理后的单体目标检测TS回波图; 其中圆圈符号表示为鱼类轨迹追踪到的鱼类信号; 不规则的粉色圈表示bad date, 不进行计算
Figure 2. The echograms of fish with 200 kHz in Reserve in April and September
A and E are the echogram of Sv before frequency difference technique processing; B and F are the echogram of Sv after frequency difference technique processing; C and G are the echogram of Ts during single target detection before frequency difference technique processing; D and H are the echogram of Ts during single target detection after frequency difference technique processing; the circle symbol represents the fish signal tracked by the fish track; the irregular pink circles indicate bad dates and are not calculated
表 1 EY60科学探鱼仪的主要技术参数设置
Table 1 Main technical parameters setting for scientific echosounder EY60
技术参数
Technical parameter参数值Parameter value 4月April 9月September 换能器频率Transducer frequency (kHz) 200 333 200 333 发射功率Transmitted power (W) 150 50 150 50 脉冲持续时间Pulse length (ms) 1.024 1.024 1.024 1.024 换能器增益Transducer gain (dB) 27 24 27 24 数据采集深度Data acquisition depth (m) 80 80 80 80 双向波束角Two-way beam angle (dB) –20.7 –20.7 –20.7 –20.7 长轴3 dB波束角Major-axis 3 dB beam angle (°) 7 7 7 7 短轴3 dB波束角Minor-axis 3 dB beam width (°) 7 7 7 7 声速Sound speed (m/s) 1494.25 1494.25 1506.07 1506.07 吸收系数Absorption coefficient (dB/m) 0.0078 0.0216 0.0069 0.0190 表 2 网具调查点位信息
Table 2 Net survey point information
点位
Position坐标
Coordinate水深Depth (m) 4月April 9月September 1 32°16′27.92″N 119°27′45.37″E 5.8 6.6 2 32°16′18.65″N 119°29′23.34″E 6.9 7.7 3 32°15′32.63″N 119°31′06.82″E 4.3 5.1 4 32°14′06.76″N 119°33′28.10″E 2.0 2.5 5 32°14′19.13″N 119°35′34.14″E 5.9 7.3 6 32°13′06.56″N 119°37′31.92″E 13.2 14.5 表 3 不同物种鱼类目标强度计算公式
Table 3 Calculation formula of target intensity for different fish
物种
Species目标强度计算公式
Calculation formula of target strength鲤 Cyprinus carpio TS=29.84×lgTL–95.23[23] 鳙 Hypophthalmichthys nobilis TS=35.88×lgTL–90.33[23] 鳊 Parabramis pekinensis TS=20.0×lgBL–70.1[24] 鲢 Hypophthalmichthys molitrix TS=20.0×lgBL–67.0[24] 鲇 Silurus asotus TS=20.0×lgTL–74.5[24] 闭鳔类 Physocilists TS=20.0×lgTL–67.4[25] 其他 Others TS=19.1×lgTL–63.9[26] 注: 表中TS为目标强度; TL为鱼体全长; BL为鱼体体长; 其他包括鲱形目、鲤形目、刺鱼目、鳉形目、鲻形目、鳕形目、金眼鲷目、鲈形目Note: TS is the target strength; TL is the fish total length; BL is fish body length; others include Clupeiformes, Cypriniformes, Gasterosteiformes, Cyprinodontiformes, Mugiliformes, Gadiformes, Beryciformes and Perciforme 表 4 单体目标检测的参数设置
Table 4 Parameter setting of the single target detection
技术参数
Technical parameter参数值
Parameter valueTS阈值TS threshold (dB) –65.00 脉冲长度测定值Pulse length determination level (dB) 6.00 最小标准脉冲长度Minimun normalized pulse length 0.20 最大标准脉冲长度Maximun normalized pulse length 1.50 波束补偿模型Beam compensation model Simrad LOBE 最大波束补偿Maximun beam compensation (dB) 4.00 短轴角的最大标准偏差Maximum standard deviation of minor-axis angles (°) 0.60 长轴角的最大标准偏差Maximum standard deviation of major-axis angles (°) 0.60 表 5 频差技术处理前后的保护区鱼类声学参数
Table 5 Acoustic parameters of fish in reserve before and after frequency difference technique
时间
Time频差技术
Frequency difference techniqueSv均值
Mean value of Sv (dB)TS均值
Mean value of TS (dB)4月April 处理前 –72.51±2.90 –58.41±3.78 处理后 –84.51±4.69* –57.26±4.26 9月September 处理前 –69.74±3.60 –55.92±3.93 处理后 –78.54±3.15* –55.57±4.03 注: 表中*代表两组数据间具有显著差异(0.001<P<0.05)Note: Sign* in the table represents significant difference between the two groups (0.001<P<0.05) 表 6 保护区渔获组成及声学评估
Table 6 Fish composition and acoustical assessment in Reserve
分类阶元
Taxonomic category数量(尾)
Quantity体长均值
Body length (cm)体质量均值
Quality (g)目标强度TS
Target strength (dB)4月Apr. 9月Sep. 4月Apr. 9月Sep. 4月Apr. 9月Sep. 4月Apr. 9月Sep. Ⅰ 鲱形目Clupeiformes ⅰ 鳀科Engraulidae 1 刀鲚Coilia nasus Temminck et Schlegel 73 22.63 37.2 –37.34 2 短颌鲚Coilia brachygnathus Kreyenberg et Pappenheim 35 57 19.23 19.17 27.7 27.6 –38.62 –38.74 Ⅱ 鲤形目Cypriniformes ⅱ 胭脂鱼科Catostomidae 3 胭脂鱼Myxocyprinus asiaticus (Bleeker) 1 11.69 41.8 –47.63 ⅲ 鲤科Cyprinidae 4 草鱼Ctenopharyngodon idella (Valenciennes) 3 34.71 857.9 –33.17 5 青鱼Mylopharyngodon piceus (Richardson) 1 7.47 6.3 –55.55 6 赤眼鳟Squaliobarbus curriculus (Richardson) 5 13.93 42.4 –46.03 7 翘嘴鲌Culter alburnus Basilewsky 1 18.45 62.2 –41.47 8 蒙古鲌Culter mongolicus (Basilewsky) 1 35.95 583.6 –31.79 9 红鳍原鲌Cultrichthys erythropterus (Basilewsky) 4 8.63 8.8 –53.85 10 贝氏䱗Hemiculter bleekeri Warpachowski 14 5 8.85 9.44 9.3 10.3 –52.79 –52.60 11 团头鲂Megalobrama amblycephala Yih 2 26.92 435.2 –41.50 12 鲂Megalobrama skolkovii Dybowsky 3 9.75 21.1 –50.32 13 鳊Parabramis pekinensis (Basilewsky) 17 45 21.31 24.83 202.5 281.8 –43.53 –42.20 14 似鳊Pseudobrama simoni (Bleeker) 39 21 12.73 11.71 39.0 28.3 –47.45 –48.97 15 银鲴Xenocypris argentea Günther 23 16.55 119.7 –43.20 16 鳙Hypophthalmichthys nobilis (Richardson) 6 32.81 1298.6 –33.46 17 鲢Hypophthalmichthys molitrix (Valenciennes) 1 54.65 3478.0 –32.25 18 棒花鱼Abbottina rivularis (Basilewsky) 1 4.83 1.4 –62.79 19 花䱻Hemibarbus maculatus Bleeker 2 3 18.63 22.66 116.3 187.7 –42.30 –38.82 20 麦穗鱼Pseudorasbora parva (Temminck et Schlegel) 1 6.10 3.6 –59.19 21 黑鳍鳈Sarcocheilichthys nigripinnis (Günther) 3 7.74 80.3 –55.94 22 华鳈Sarcocheilichthys sinensis Bleeker 1 12.44 46.0 –48.10 23 蛇Saurogobio dabryi Bleeker 9 59 14.38 8.95 29.0 12.1 –46.46 –53.62 24 长蛇Saurogobio dumerili Bleeker 1 10 18.70 20.80 47.5 76.8 –42.59 –40.89 25 光唇蛇Saurogobio gymnocheilus Lo, Yao et Chen 2 7.87 3.8 –56.10 26 银Squalidus argentatus (Sauvage et Dabry) 14 21 6.46 6.78 3.8 5.1 –59.82 –57.50 27 兴凯鱊Acheilognathus chankaensis (Dybowsky) 2 5.28 4.0 –55.64 28 斑条鱊Acheilognathus taenianalis Günther 5 7.12 10.5 –57.45 29 鲫Carassius auratus auratus (Linnaeus) 5 2 13.26 6.41 68.6 37.9 –58.83 –68.17 30 鲤Cyprinus carpio Linnaeus 2 37.43 1010.3 –46.66 ⅳ 鳅科Cobitidae* 31 紫薄鳅Leptobotia taeniaps (Sauvage) 1 7.45 5.2 32 武昌副沙鳅Parabotia banarescui (Nalbant) 1 9.37 5.4 33 花斑副沙鳅Parabotia fasciata Dabry Guichenot 1 6.00 1.2 34 泥鳅Misgurnus anguillicaudatus (Cantor) 1 2 15.23 12.56 27.4 12.6 Ⅲ 鲇形目Siluriformes ⅵ 鲿科Bagridae 35 长吻Leiocassis longirostris Günther 5 10.64 44.3 –53.96 36 黄颡鱼Pelteobagrus fulvidraco (Richardson) 1 4 19.42 11.26 128.3 33.3 –39.29 –53.47 37 光泽黄颡鱼Pelteobaggrus nitidus (Sauvage et Dabry) 9 129 14.63 8.43 46.4 9.2 –51.19 –55.98 38 瓦氏黄颡鱼Pelteobagrus vachelli (Richardson) 3 16 15.92 7.43 33.6 5.3 –50.46 –57.08 ⅴ 鲇科Siluridae* 39 鲇Silurus asotus Linnaeus 1 12.22 16.7 40 南方鲇Silurus meridionalis Chen 1 20.70 87.3 Ⅳ 鲈形目Perciformes ⅶ 鮨科Serranidae 41 中国花鲈Lateolabrax maculatus (McClelland) 3 18.75 272.2 –40.76 42 鳜Siniperca chuatsi (Basilewsky) 1 17.57 112.7 –43.01 43 大眼鳜Siniperca kneri Garman 5 4 14.54 9.37 74.7 16.5 –45.66 –52.70 ⅷ 䲗科Callionymidae* 44 香斜棘䲗Repomucenus olidus Günther 1 3.59 0.6 ⅹ 塘鳢科Eleotridae * 45 尖头塘鳢Eleotris oxycephala Temminck et Schlegel 1 15.42 54.9 ⅸ 虾虎鱼科Gobiidae* 46 子陵吻虾虎鱼Rhinogobius giurinus (Rutter) 57 4.74 2.5 Ⅴ 鲽形目 Pleuronectiformes* xi 舌鳎科Cynoglossidae 47 窄体舌鳎Cynoglossus(Areliscus) gracilis Günther 3 4 27.35 23.21 95.5 73.3 Ⅵ 鳗鲡目Anguilliformes* xii 鳗鲡科Anguillidae 48 鳗鲡Anguilla japonica Temminck et Schlegel 2 15.49 75.5 注: 表中*物种为底栖生物, 不进行声学评估Note: Sign* in the table are benthic and no acoustical assessment is performed -
[1] 李哲, 朱文斌, 陈峰, 等. 近年我国渔业资源声学评估研究进展 [J]. 浙江海洋大学学报(自然科学版), 2021, 40(1): 80-85, 92. Li Z, Zhu W B, Chen F, et al. Recent advances in acoustic assessment of fishery resources in China [J]. Journal of Zhejiang Ocean University (
Natural Science ) , 2021, 40(1): 80-85, 92. [2] 陶江平, 艾为明, 龚昱田, 等. 采用渔业声学方法和GIS模型对楠溪江鱼类资源量及空间分布的评估 [J]. 生态学报, 2010, 30(11): 2992-3000. Tao J P, Ai W M, Gong Y T, et al. Assessment of fish abundance and distribution using fisheries acoustics and GIS modeling in the Nanxi River of Wenzhou City [J]. Acta Ecologica Sinica, 2010, 30(11): 2992-3000.
[3] La H S, Lee H, Kang D, et al. Ex situ echo sounder target strengths of ice krill Euphausia crystallorophias [J]. Chinese Journal of Oceanology and Limnology, 2015, 33(3): 802-808. doi: 10.1007/s00343-015-4064-3
[4] Tan X, Kang M, Tao J, et al. Hydroacoustic survey of fish density, spatial distribution, and behavior upstream and downstream of the Changzhou Dam on the Pearl River, China [J]. Fisheries Science, 2011, 77(6): 891-901. doi: 10.1007/s12562-011-0400-5
[5] Draštík V, Kubečka J, Tušer M, et al. The effect of hydropower on fish stocks: comparison between cascade and non-cascade reservoirs [J]. Hydrobiologia, 2008, 609(1): 25-36. doi: 10.1007/s10750-008-9393-1
[6] 王靖, 张超, 王丹, 等. 清河水库鲢鳙鱼类资源声学评估——回波计数与回波积分法的比较 [J]. 南方水产, 2010, 6(5): 50-55. Wang J, Zhang C, Wang D, et al. Acoustic assessment of silver carp and bighead carp in Qinghe Reservoir: comparing echo-counting and echo-integrating methods [J]. South China Fisheries Science, 2010, 6(5): 50-55.
[7] Davison P C, Koslow J A, Kloser R J. Acoustic biomass estimation of mesopelagic fish: backscattering from individuals, populations, and communities [J]. ICES Journal of Marine Science, 2015, 72(5): 1413-1424. doi: 10.1093/icesjms/fsv023
[8] Korneliussen R J, Ona E. An operational system for processing and visualizing multi-frequency acoustic data [J]. ICES Journal of Marine Science, 2002, 59(2): 293-313. doi: 10.1006/jmsc.2001.1168
[9] McKelvey D R, Wilson C D. Discriminant classification of fish and zooplankton backscattering at 38 and 120 kHz [J]. Transactions of the American Fisheries Society, 2006, 135(2): 488-499. doi: 10.1577/T04-140.1
[10] De Robertis A, McKelvey D R, Ressler P H. Development and application of an empirical multifrequency method for backscatter classification [J]. Canadian Journal of Fisheries and Aquatic Sciences, 2010, 67(9): 1459-1474. doi: 10.1139/F10-075
[11] Zhang J, Zhang K, Chen Z, et al. Hydroacoustic studies on Katsuwonus pelamis and juvenile Thunnus albacares associated with light fish-aggregating devices in the South China Sea [J]. Fisheries Research, 2021(233): 105765. doi: 10.1016/j.fishres.2020.105765
[12] McQuinn I H, Dion M, St Pierre J F. The acoustic multifrequency classification of two sympatric euphausiid species (Meganyctiphanes norvegica and Thysanoessa raschii), with empirical and SDWBA model validation [J]. ICES Journal of Marine Science, 2013, 70(3): 636-649. doi: 10.1093/icesjms/fst004
[13] Lopez-Serrano A, Villalobos-Ortiz H, Nevarez-Martinez M O. A probabilistic approach to calculate the Sv fractions for small pelagic fishes and zooplankton with a bi-frequency system [C]//2015 IEEE/OES Acoustics in Underwater Geosciences Symposium (RIO Acoustics). Rio de Janeiro, Brazil. IEEE, 2015: 1-5.
[14] 王新良, 赵宪勇, 左涛, 等. 黄海太平洋磷虾回波映像识别与资源密度评估 [J]. 水产学报, 2016, 40(7): 1080-1088. Wang X L, Zhao X Y, Zuo T, et al. Acoustical identification and density estimation of Euphausia pacifica in the Yellow Sea [J]. Journal of Fisheries of China, 2016, 40(7): 1080-1088.
[15] 任玉芹, 王珂, 段辛斌, 等. 水声学探测在江河鱼类资源评估中的技术分析 [J]. 渔业现代化, 2010, 37(2): 64-68. doi: 10.3969/j.issn.1007-9580.2010.02.015 Ren Y Q, Wang K, Duan X B, et al. Technical analysis of acoustic survey in the river water fish resource evaluation [J]. Fishery Modernization, 2010, 37(2): 64-68. doi: 10.3969/j.issn.1007-9580.2010.02.015
[16] 朱孝锋, 高成洪, 韦龙, 等. 江苏镇江长江豚类省级自然保护区建设的启迪 [J]. 中国渔业经济, 2008, 26(1): 25-28. doi: 10.3969/j.issn.1009-590X.2008.01.006 Zhu X F, Gao C H, Wei L, et al. Edification of establishing Zhenjiang of Jiangsu Yangtze Dolphin provincial nature reserve [J]. Chinese Fisheries Economics, 2008, 26(1): 25-28. doi: 10.3969/j.issn.1009-590X.2008.01.006
[17] 代梨梨, 龚迎春, 冯伟松, 等. 江苏镇江长江豚类保护区浮游动物群落结构特征及江豚生存状况评估 [J]. 水生态学杂志, 2011, 32(5): 30-36. doi: 10.15928/j.1674-3075.2011.05.001 Dai L L, Gong Y C, Feng W S, et al. Community structure of zooplankton and its relationship to survivability of Yangtze dolphin in Zhenjiang Yangtze dolphin nature reserve, Jiangsu Province [J]. Journal of Hydroecology, 2011, 32(5): 30-36. doi: 10.15928/j.1674-3075.2011.05.001
[18] 刘胜, 徐承旭. 长江江豚升级为国家一级保护动物 [J]. 水产科技情报, 2021, 48(2): 117-118. Liu S, Xu C X. Yangtze finless porpoise has been upgraded to a national first-class protected animal [J]. Fisheries Science & Technology Information, 2021, 48(2): 117-118.
[19] 王崇瑞, 索纹纹, 蒋国民, 等. 东洞庭湖长江江豚及其与鱼类资源相关性 [J]. 中国环境科学, 2019, 39(10): 4424-4434. doi: 10.3969/j.issn.1000-6923.2019.10.048 Wang C R, Suo W W, Jiang G M, et al. Spatial distribution of the Yangtze finless porpoise and relationship to fish density in East Dongting Lake, China [J]. China Environmental Science, 2019, 39(10): 4424-4434. doi: 10.3969/j.issn.1000-6923.2019.10.048
[20] Guillard J, Vergès C. The repeatability of fish biomass and size distribution estimates obtained by hydroacoustic surveys using various sampling strategies and statistical analyses [J]. International Review of Hydrobiology, 2007, 92(6): 605-617. doi: 10.1002/iroh.200710948
[21] Godlewska M, Długoszewski B, Doroszczyk L, et al. The relationship between sampling intensity and sampling error-empirical results from acoustic surveys in Polish vendace lakes [J]. Fisheries Research, 2009, 96(1): 17-22. doi: 10.1016/j.fishres.2008.09.014
[22] Simrad. Simrad ER60, Scientific Echo Sounder, Reference Manual [M]. Norway: Simrad Maritime as Kongsberg, 2008: 19-31.
[23] 陈霄航, 连玉喜, 黄耿, 等. 两种鲤科经济鱼类水声目标强度的实验测定与应用评估 [J]. 水生生物学报, 2019, 43(4): 854-860. doi: 10.7541/2019.101 Chen X H, Lian Y X, Huang G, et al. The experimental design and application of hydroacoustical techniques for target strength of two commercial Cyprinidae fish species [J]. Acta Hydrobiologica Sinica, 2019, 43(4): 854-860. doi: 10.7541/2019.101
[24] 谢晓, 张辉, 孙立元, 等. 基于网箱控制法和模型法的长江4种淡水鱼目标强度研究 [J]. 中国水产科学, 2020, 27(5): 536-546. Xie X, Zhang H, Sun L Y, et al. Target strength of four freshwater fish species in the Yangtze River based on cage and model method [J]. Journal of Fishery Sciences of China, 2020, 27(5): 536-546.
[25] Foote K G. Fish target strengths for use in echo integrator surveys [J]. The Journal of the Acoustical Society of America, 1987, 82(3): 981-987. doi: 10.1121/1.395298
[26] Love R H. Dorsal-aspect target strength of an individual fish [J]. The Journal of the Acoustical Society of America, 1971, 49(3B): 816-823. doi: 10.1121/1.1912422
[27] Higginbottom I, Woon S, Schneider P. Hydroacoustic Data Processing for Standard Stock Assessment Using Echoview: Technical Manual [M]. Australia: Myriax Software Pty Ltd Publication, 2008: 70-85.
[28] 龚成, 陈祖欣, 程飞. 长江天鹅洲故道长江江豚饵料鱼类状况与管理建议 [J]. 中国水产, 2019(6): 43-45. Gong C, Chen Z X, Cheng F. Status and management suggestions of feed fish of Yangtze finless porpoise in the old channel of Tianezhou, Yangtze River [J]. China Fisheries, 2019(6): 43-45.
[29] 杨丙山. 半自然水域中长江江豚食物选择的初步观察 [J]. 环保科技, 2019, 25(5): 18-21. doi: 10.3969/j.issn.1674-0254.2019.05.005 Yang B S. Preliminary observations on feeding choice of finless porpoises in semi-nature reserve [J]. Environmental Protection and Technology, 2019, 25(5): 18-21. doi: 10.3969/j.issn.1674-0254.2019.05.005
[30] Szczucka J, Hoppe Ł, Schmidt B, et al. Acoustical estimation of fish distribution and abundance in two Spitsbergen fjords [J]. Oceanologia, 2017, 59(4): 585-591. doi: 10.1016/j.oceano.2017.04.007
[31] 张俊, 陈丕茂, 陈国宝, 等. 基于Echoview声学数据后处理系统的背景噪声扣除方法 [J]. 渔业科学进展, 2014, 35(1): 9-17. doi: 10.3969/j.issn.1000-7075.2014.01.002 Zhang J, Chen P M, Chen G B, et al. Study on background noise removal based on Echoview acoustic data post-processing system [J]. Progress in Fishery Sciences, 2014, 35(1): 9-17. doi: 10.3969/j.issn.1000-7075.2014.01.002
[32] 陈文静, 贺刚, 吴斌, 等. 鄱阳湖通江水道鱼类空间分布特征及资源量评估 [J]. 湖泊科学, 2017, 29(4): 923-931. doi: 10.18307/2017.0416 Chen W J, He G, Wu B, et al. Spatial distribution and biomass assessment of fish in the channel connecting the Lake Poyang and the Yangtze River [J]. Journal of Lake Sciences, 2017, 29(4): 923-931. doi: 10.18307/2017.0416
[33] 段辛斌, 谢意军, 郭杰, 等. 长江中游洪湖至宜昌江段鱼类空间分布特征的水声学研究 [J]. 长江流域资源与环境, 2016, 25(12): 1842-1849. doi: 10.11870/cjlyzyyhj201612007 Duan X B, Xie Y J, Guo J, et al. Hydroacoustic surveys on temporal and spatial distribution of fishes in the section from Honghu to Yichang of the Yangtze River middle reaches [J]. Resources and Environment in the Yangtze Basin, 2016, 25(12): 1842-1849. doi: 10.11870/cjlyzyyhj201612007
[34] 李君轶. 长江上游鱼类保护区干流渔获物组成及鱼类空间分布的研究 [D]. 武汉: 华中农业大学, 2014. Li J Y. Study on catch composition and spatial distribution of fish in the main stream of the Upper Yangtze River fish reserve [D]. Wuhan: Huazhong Agricultural University, 2014.
[35] 刘飞, 林鹏程, 黎明政, 等. 长江流域鱼类资源现状与保护对策 [J]. 水生生物学报, 2019, 43(S1): 144-156. doi: 10.7541/2019.177 Liu F, Lin P C, Li M Z, et al. Situations and conservation strategies of fish resources in the Yangtze River Basin [J]. Acta Hydrobiologica Sinica, 2019, 43(S1): 144-156. doi: 10.7541/2019.177
[36] 曹过, 李佩杰, 王媛, 等. 长江下游镇江和畅洲北汊江段鱼类群落多样性研究 [J]. 水生态学杂志, 2018, 39(6): 73-80. doi: 10.15928/j.1674-3075.2018.06.011 Cao G, Li P J, Wang Y, et al. Study on fish community diversity in the north of hechangzhou section of the Lower Yangtze River [J]. Journal of Hydroecology, 2018, 39(6): 73-80. doi: 10.15928/j.1674-3075.2018.06.011
[37] 王生, 段辛斌, 陈文静, 等. 鄱阳湖湖口鱼类资源现状调查 [J]. 淡水渔业, 2016, 46(6): 50-55. doi: 10.3969/j.issn.1000-6907.2016.06.009 Wang S, Duan X B, Chen W J, et al. Status and changes of fish resources in the Hukou area of Poyang Lake [J]. Freshwater Fisheries, 2016, 46(6): 50-55. doi: 10.3969/j.issn.1000-6907.2016.06.009
[38] 蒲仕明. 长江流域重点水域“十年禁渔”全面启动 [J]. 乡村振兴, 2021(1): 44-45. Pu S M. The “ten-year fishing ban” in key waters of the Yangtze River Basin was launched in an all-round way [J]. Rural Revitalization, 2021(1): 44-45.
[39] 刘群, 任一平, 沈海学, 等. 渔业资源评估在渔业管理中的作用 [J]. 海洋湖沼通报, 2003(1): 72-76. doi: 10.3969/j.issn.1003-6482.2003.01.012 Liu Q, Ren Y P, Shen H X, et al. The role of stock assessment in fisheries management [J]. Transactions of Oceanology and Limnology, 2003(1): 72-76. doi: 10.3969/j.issn.1003-6482.2003.01.012
-
期刊类型引用(5)
1. 史银魁,俞立雄,周雪,高雷,朱峰跃,杨锦毅,陈大庆,王珂,段辛斌. 禁渔初期长江宜昌-城陵矶江段鱼类资源时空分布特征. 水生生物学报. 2024(04): 546-558 .  本站查看
本站查看
2. 潘杰,王召根,邢晓勇,朱锡峰. 江苏镇江长江豚类省级自然保护区智能监控系统的建设与应用. 农业装备技术. 2024(01): 59-61 .  百度学术
百度学术
3. 李栋,蔺丹清,王召根,潘杰,邢晓勇,叶昆,刘凯. 江苏镇江长江豚类省级自然保护区长江江豚种群分布与水下噪声的关系探究. 水生生物学报. 2024(10): 1660-1671 .  本站查看
本站查看
4. 赵巍,崔海朋. 深远海养殖生物量监测研究现状与案例分析. 科技与金融. 2023(09): 13-18 .  百度学术
百度学术
5. 张蓥钰,董芳,方康,万朝阳,刘黄欣,盖帅帅,吴金明,杜浩,张曼,张辉. 长江鱼类体长变化及其对资源变动的指征作用. 中国水产科学. 2023(12): 1507-1519 .  百度学术
百度学术
其他类型引用(1)


 下载:
下载:
